OPEN-SOURCE SCRIPT
Sharpe Ratio Indicator (180)
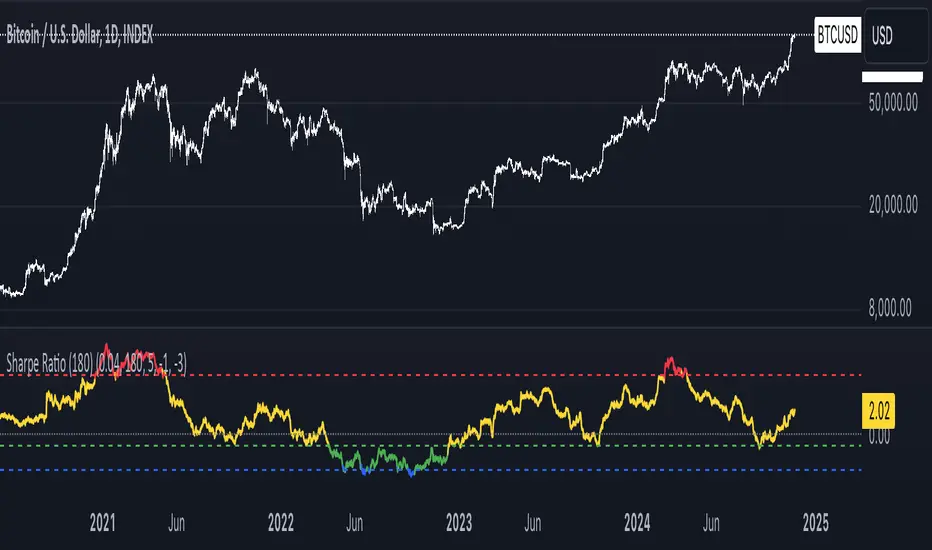
Meant to be used on the 1D chart and on BTC.
The Sharpe Ratio Indicator (180 days) is a tool for evaluating risk-adjusted returns, designed for investors who want to assess whether BTC is overvalued, undervalued, or in a neutral state. It plots the Sharpe Ratio over the past 180 days, color-coded to indicate valuation states:
- Red: Overvalued (Sharpe Ratio > 5).
- Green: Undervalued (Sharpe Ratio < -1).
-Blue: Critically Undervalued (Sharpe Ratio <-3).
- Yellow: Neutral (between -1 and 5).
Note that you can change those values yourself in the settings of the indicator.
Strengths:
- Real-time feedback on risk-adjusted returns helps in making timely investment decisions.
- Color-coded signals (red, green, blue and yellow) provide an intuitive, visual indication of the asset's valuation.
- Flexible: Easily adjustable to different subjective valuation levels and risk-free rates.
All hail to Professor Adam and The Real World Community!
نص برمجي مفتوح المصدر
بروح TradingView الحقيقية، قام مبتكر هذا النص البرمجي بجعله مفتوح المصدر، بحيث يمكن للمتداولين مراجعة وظائفه والتحقق منها. شكرا للمؤلف! بينما يمكنك استخدامه مجانًا، تذكر أن إعادة نشر الكود يخضع لقواعد الموقع الخاصة بنا.
إخلاء المسؤولية
لا يُقصد بالمعلومات والمنشورات أن تكون، أو تشكل، أي نصيحة مالية أو استثمارية أو تجارية أو أنواع أخرى من النصائح أو التوصيات المقدمة أو المعتمدة من TradingView. اقرأ المزيد في شروط الاستخدام.