OPEN-SOURCE SCRIPT
تم تحديثه Global Central Banks Balance Sheet USD-Adjusted
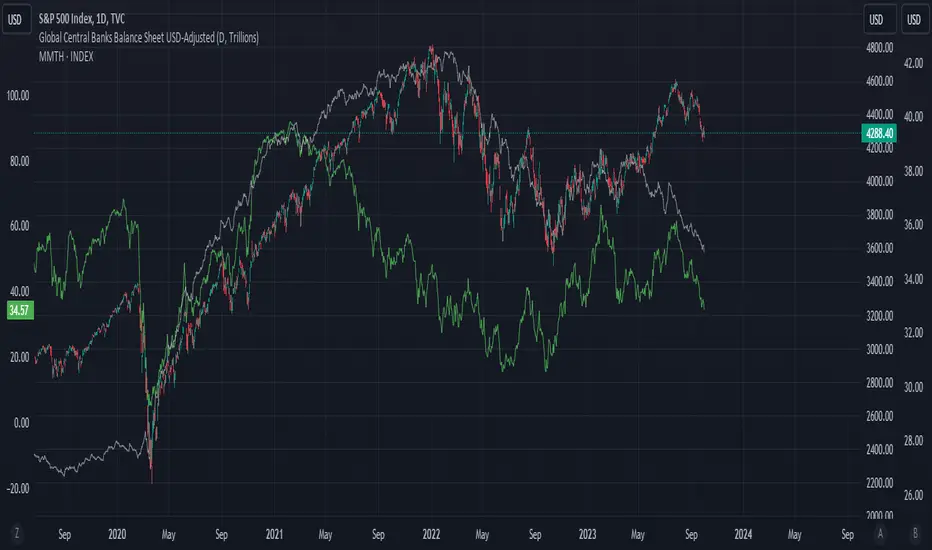
Summing up central banks balance sheet of:
US , China, EU, Japan, UK,
Swiss, Australia, Canada, Norway
Brazil, Russia, India, Mexico, Indonesia
Taiwan, HK, Korea, SG, Thailand
Then adjusting it to USD as the common denominator for comparison.
Net Foreign Assets (or foreign reserves) + Net Domestic Assets (or domestic credit, usually Money Supply M1) = Total Assets of the Central Bank Balance Sheet
In some way, the central bank balance sheet could be M2. However, I find some of the indicators don't add up and I don't have the time to check them out. This indicator is just a proxy. The issue with using central bank balance sheet to determine liquidity in the system is that it doesn't account for 1) collateral used for liquidity management in the public and private system, 2) shadow-banking financial system. As usual, US + EU + Japan publishes their data every weekly and the rest of the central banks publish monthly. I have removed any country with hard-pegged currencies except HK.
Additional materials to aid understanding:
imf.org/-/media/Files/News/Seminars/2017/macroeconomist-training-program-011118/session-2-1.ashx
ملاحظات الأخبار
oreilly.com/library/view/central-bank-balance/9781547400591/content/13_chapter03.xhtmlyardeni.com/pub/balsheetwk.pdf
ECB, Fed and BOJ updates weekly. The rest is monthly or annually.
ملاحظات الأخبار
Changed the intro chart back to SPX vs market breadth vs this indicatorملاحظات الأخبار
-نص برمجي مفتوح المصدر
بروح TradingView الحقيقية، قام مبتكر هذا النص البرمجي بجعله مفتوح المصدر، بحيث يمكن للمتداولين مراجعة وظائفه والتحقق منها. شكرا للمؤلف! بينما يمكنك استخدامه مجانًا، تذكر أن إعادة نشر الكود يخضع لقواعد الموقع الخاصة بنا.
إخلاء المسؤولية
لا يُقصد بالمعلومات والمنشورات أن تكون، أو تشكل، أي نصيحة مالية أو استثمارية أو تجارية أو أنواع أخرى من النصائح أو التوصيات المقدمة أو المعتمدة من TradingView. اقرأ المزيد في شروط الاستخدام.
نص برمجي مفتوح المصدر
بروح TradingView الحقيقية، قام مبتكر هذا النص البرمجي بجعله مفتوح المصدر، بحيث يمكن للمتداولين مراجعة وظائفه والتحقق منها. شكرا للمؤلف! بينما يمكنك استخدامه مجانًا، تذكر أن إعادة نشر الكود يخضع لقواعد الموقع الخاصة بنا.
إخلاء المسؤولية
لا يُقصد بالمعلومات والمنشورات أن تكون، أو تشكل، أي نصيحة مالية أو استثمارية أو تجارية أو أنواع أخرى من النصائح أو التوصيات المقدمة أو المعتمدة من TradingView. اقرأ المزيد في شروط الاستخدام.