OPEN-SOURCE SCRIPT
تم تحديثه MA Support & Resistance Signal
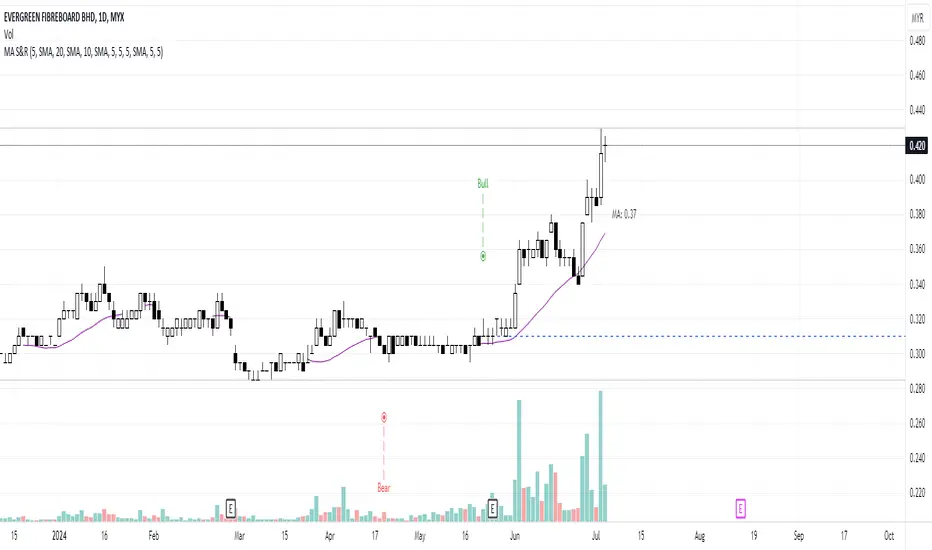
This indicator is to show MA Support/Resistance and trend of a stock.
It contains three (3) Moving Averages that can be set to SMA or EMA:
1. Upper Line: SMA 5 (default)
2. Lower Line: SMA 20 (default)
3. Support/Resistance Line: SMA 10 (default)
Other signals:
1. Bull and Blue Dotted Line signal: Upper Line (SMA 5) crossover with Lower Line (SMA 20).
2. Bear and Red Dotted Line signal: Lower Line (SMA 20) crossover with Upper Line (SMA 5).
3. Red Triangle signal: Price closes below Support/Resistance Line (SMA 10).
4. Green Bar signal: Price breaks Support/Resistance Line (SMA 10).
The way how I use it:
- Since I don't like my chart to be crowded with a lot of moving averages, I will disable SMA 5 and SMA 10 and will only leave SMA 20 as my final support line.
- Entry when only:
1. Bull signal appeared.
2. Green bar appeared, or;
3. Price rebound on SMA 20.
I let the script open so that you guys can custom it based on your own preferences. Hope you guys enjoy it.
ملاحظات الأخبار
Update Script: Include label display for MA Priceملاحظات الأخبار
Latest update:Price label color for SMA has been changed from RED to TRANSPARENT
نص برمجي مفتوح المصدر
بروح TradingView الحقيقية، قام مبتكر هذا النص البرمجي بجعله مفتوح المصدر، بحيث يمكن للمتداولين مراجعة وظائفه والتحقق منها. شكرا للمؤلف! بينما يمكنك استخدامه مجانًا، تذكر أن إعادة نشر الكود يخضع لقواعد الموقع الخاصة بنا.
إخلاء المسؤولية
لا يُقصد بالمعلومات والمنشورات أن تكون، أو تشكل، أي نصيحة مالية أو استثمارية أو تجارية أو أنواع أخرى من النصائح أو التوصيات المقدمة أو المعتمدة من TradingView. اقرأ المزيد في شروط الاستخدام.