OPEN-SOURCE SCRIPT
تم تحديثه Weekly Profiles [TFO]
This Weekly Profiles indicator was built to overlay historical data to show how prior weeks of price action have unfolded under specified input conditions.
When "Show Historical Weekly Profiles" is enabled, the indicator draws out how prior weeks have traded. This is done by tracking weekly price movements, measuring the percent change from each week's respective weekly open price, and translating that percent change to the current week's open price to visually describe how price fluctuated in those previous weeks.

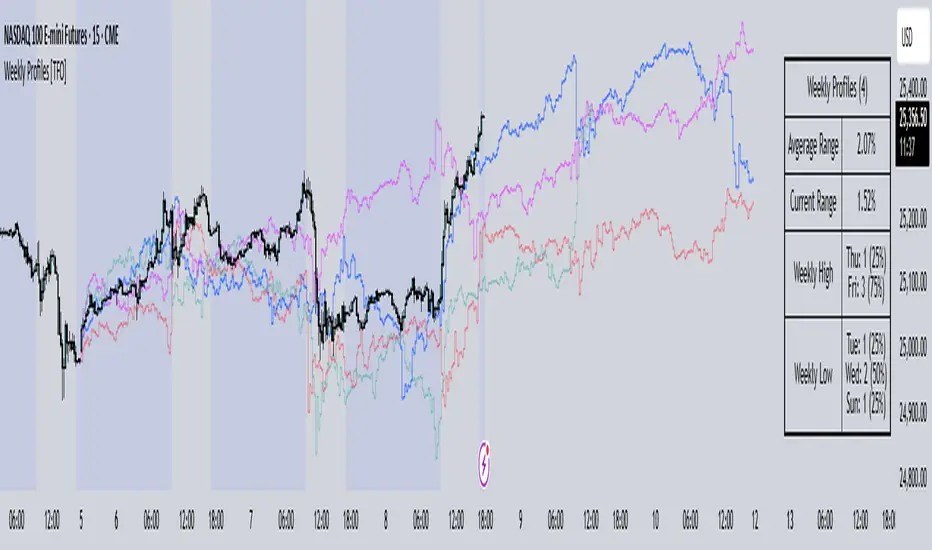
With "Show Weekly Profile Table" enabled, we can observe some basic statistics on the weekly profiles that have been collected, such as the average range and which days have made the high/low of the week from the given dataset.

There are also options to refine the dataset by specifying which days have made the high/low of the week, which will only show profiles that meet said criteria. For instance, by enabling "Low of Week" and selecting "Monday", the indicator will show every weekly profile that made its low on a Monday. In the following chart, we can again use the table to observe that we currently have 14 such weeks on NQ1! (from the data available on our current chart timeframe and TradingView plan), whose average range is 3.65% from the week's low to the week's high, and from those 14 weeks, the high of the week was made on a Friday 10 times or 71% of the time.

The "Profile Resolution" option specifies the interval at which to show changes in price (given that it is greater than or equal to the current chart timeframe). In the below chart, the Profile Resolution is set to 4 hours. As such, it simplifies the profiles by tracking the close price of each 4 hour candle (again as a percent change from each profile's respective open price). The larger Profile Resolution can make it easier to observe commonalities between profiles, such as the below chart of NQ1! that highlights a noticeable price decrease during the New York morning session across several of the available weekly profiles.

There is also an option to "Highlight Closest Profiles" which does exactly that. Essentially, all weekly profiles are given a score according to how close the current week's price action is matching each profile up until the current point in time. For example, if one were observing this indicator on a Wednesday afternoon, each profile would be scored according to how close price is to each profile, starting from the weekly open, up until the Wednesday afternoon of each profile. Everything after that point in time is disregarded since it hasn't happened yet and can't be measured. With this in mind, profiles with greater similarity to the current week are highlighted with deeper colors, and profiles with lesser similarity are given lighter, more transparent colors.

The "Randomize Colors" option will use various colors for the weekly profiles for easier visual differentiation (especially where there are several profiles crowding each other), as opposed to otherwise having one color for all profiles. Lastly, there are basic styling options to control the table position, table size, and the line width of all weekly profiles.
When "Show Historical Weekly Profiles" is enabled, the indicator draws out how prior weeks have traded. This is done by tracking weekly price movements, measuring the percent change from each week's respective weekly open price, and translating that percent change to the current week's open price to visually describe how price fluctuated in those previous weeks.
With "Show Weekly Profile Table" enabled, we can observe some basic statistics on the weekly profiles that have been collected, such as the average range and which days have made the high/low of the week from the given dataset.
There are also options to refine the dataset by specifying which days have made the high/low of the week, which will only show profiles that meet said criteria. For instance, by enabling "Low of Week" and selecting "Monday", the indicator will show every weekly profile that made its low on a Monday. In the following chart, we can again use the table to observe that we currently have 14 such weeks on NQ1! (from the data available on our current chart timeframe and TradingView plan), whose average range is 3.65% from the week's low to the week's high, and from those 14 weeks, the high of the week was made on a Friday 10 times or 71% of the time.
The "Profile Resolution" option specifies the interval at which to show changes in price (given that it is greater than or equal to the current chart timeframe). In the below chart, the Profile Resolution is set to 4 hours. As such, it simplifies the profiles by tracking the close price of each 4 hour candle (again as a percent change from each profile's respective open price). The larger Profile Resolution can make it easier to observe commonalities between profiles, such as the below chart of NQ1! that highlights a noticeable price decrease during the New York morning session across several of the available weekly profiles.
There is also an option to "Highlight Closest Profiles" which does exactly that. Essentially, all weekly profiles are given a score according to how close the current week's price action is matching each profile up until the current point in time. For example, if one were observing this indicator on a Wednesday afternoon, each profile would be scored according to how close price is to each profile, starting from the weekly open, up until the Wednesday afternoon of each profile. Everything after that point in time is disregarded since it hasn't happened yet and can't be measured. With this in mind, profiles with greater similarity to the current week are highlighted with deeper colors, and profiles with lesser similarity are given lighter, more transparent colors.
The "Randomize Colors" option will use various colors for the weekly profiles for easier visual differentiation (especially where there are several profiles crowding each other), as opposed to otherwise having one color for all profiles. Lastly, there are basic styling options to control the table position, table size, and the line width of all weekly profiles.
ملاحظات الأخبار
- Limit the number of closest weekly profiles that should be displayed (that best approximate current price action)- Add table options
- Add option to show date labels
نص برمجي مفتوح المصدر
بروح TradingView الحقيقية، قام مبتكر هذا النص البرمجي بجعله مفتوح المصدر، بحيث يمكن للمتداولين مراجعة وظائفه والتحقق منها. شكرا للمؤلف! بينما يمكنك استخدامه مجانًا، تذكر أن إعادة نشر الكود يخضع لقواعد الموقع الخاصة بنا.
إخلاء المسؤولية
لا يُقصد بالمعلومات والمنشورات أن تكون، أو تشكل، أي نصيحة مالية أو استثمارية أو تجارية أو أنواع أخرى من النصائح أو التوصيات المقدمة أو المعتمدة من TradingView. اقرأ المزيد في شروط الاستخدام.