OPEN-SOURCE SCRIPT
تم تحديثه Buy/Sell Alert EMA with SuperFormula by zdmre
*** Use it at your own risk
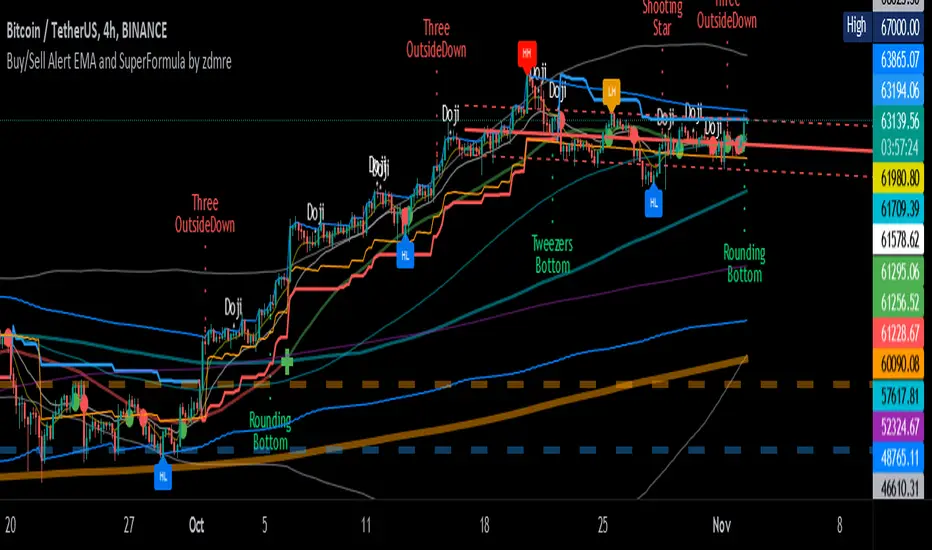
This indicator has 3 indicators and gives a buy/sell signal depending on the EMA.
3 indicators:
It also shows the value on the candle as a warning in the Buy and Sell signals. This value is calculated with a special formula I have created.
On the other hand Bollinger Band and Ichimoku Cloud are also included to check the accuracy of the signals.
For this indicator, I recommend a minimum of 4 hours chart.
This indicator has 3 indicators and gives a buy/sell signal depending on the EMA.
3 indicators:
- - Ichimoku
- - Bollinger Band
- - EMA
It also shows the value on the candle as a warning in the Buy and Sell signals. This value is calculated with a special formula I have created.
On the other hand Bollinger Band and Ichimoku Cloud are also included to check the accuracy of the signals.
For this indicator, I recommend a minimum of 4 hours chart.
ملاحظات الأخبار
v 2.0-adding THEIL-SEN ESTIMATOR @tbiktag (Thanks my friend)
-changing default EMA values to 8-20
ملاحظات الأخبار
Release Notes: v 3.0-Adding Bitcoin Investor Tool: 2-Year MA Multiplier + 1-Year MA
-Adding Pi Cycle Top Indicator
ملاحظات الأخبار
Release Notes: Release Notes: v 4.0-Adding KAMA Indicator
-Adding Cup Indicator
ملاحظات الأخبار
Max bar problem fixed.Trailing Stop Loss improved.
"Show Buy/Sell Signals" added. Default value=true
"Show Calculation Values" added. Default value=false
ملاحظات الأخبار
Improved RSI, Sell Point, Calc Value Label.Added "Show TrailingSTOP Prices" label.
ملاحظات الأخبار
Updated PineScript version 5Added Pattern Trend Calculations (Fibonacci, RSI, DMI)
Added Flagging
Added ZigZag (HH-HL-LH-LL)
Added Tables
Added Advanced Patterns
and more
ملاحظات الأخبار
Removed KAMA,Removed Cup,
Removed Pattern Trend Calculations (Fibonacci, RSI, DMI)
Removed Tables,
Added Advanced Patterns
Added Cup and Handle.
Optimization and Visual improvements.
ملاحظات الأخبار
Bug fixes.نص برمجي مفتوح المصدر
بروح TradingView الحقيقية، قام مبتكر هذا النص البرمجي بجعله مفتوح المصدر، بحيث يمكن للمتداولين مراجعة وظائفه والتحقق منها. شكرا للمؤلف! بينما يمكنك استخدامه مجانًا، تذكر أن إعادة نشر الكود يخضع لقواعد الموقع الخاصة بنا.
إخلاء المسؤولية
لا يُقصد بالمعلومات والمنشورات أن تكون، أو تشكل، أي نصيحة مالية أو استثمارية أو تجارية أو أنواع أخرى من النصائح أو التوصيات المقدمة أو المعتمدة من TradingView. اقرأ المزيد في شروط الاستخدام.
نص برمجي مفتوح المصدر
بروح TradingView الحقيقية، قام مبتكر هذا النص البرمجي بجعله مفتوح المصدر، بحيث يمكن للمتداولين مراجعة وظائفه والتحقق منها. شكرا للمؤلف! بينما يمكنك استخدامه مجانًا، تذكر أن إعادة نشر الكود يخضع لقواعد الموقع الخاصة بنا.
إخلاء المسؤولية
لا يُقصد بالمعلومات والمنشورات أن تكون، أو تشكل، أي نصيحة مالية أو استثمارية أو تجارية أو أنواع أخرى من النصائح أو التوصيات المقدمة أو المعتمدة من TradingView. اقرأ المزيد في شروط الاستخدام.