OPEN-SOURCE SCRIPT
تم تحديثه Moving Averages Ribbon (7 EMAs/SMAs)
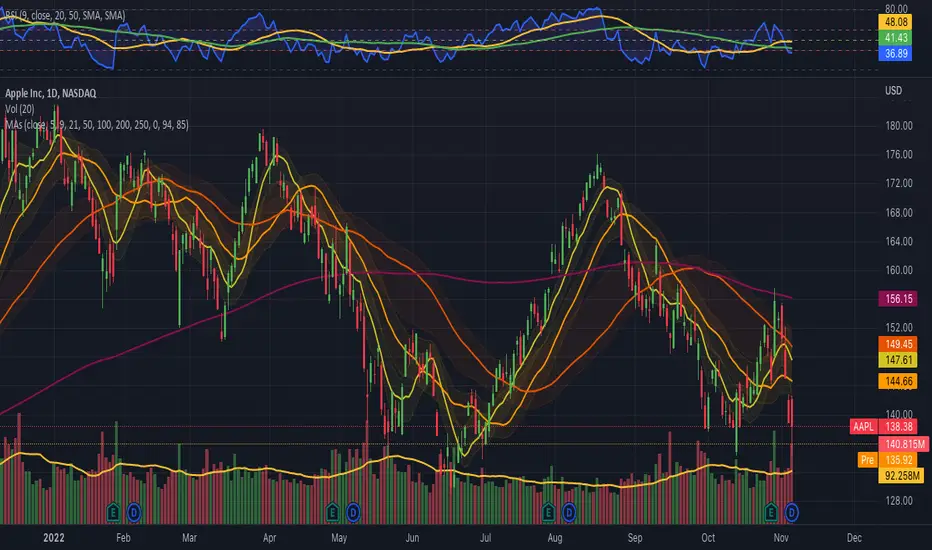
This Indicator provides a combination which is suitable for visualizing many Simple Moving Averages (SMAs) and Exponential Moving Averages (EMAs). There are 7 possible periods 5,9,20,50,100,200,250. There is a possibility to show only EMAs or only SMAs or both. EMAs have thinner curves by default, to be able to distinguish them from SMAs. Additionally, there are highlighted channels between the MAs of the highs and the MAs of the lows, showing a channel of specific moving averages. It comes with a presetting showing EMAs 5,9,20,50,200 and SMAs 9,20,50,200, while the MA channels are only visible for 9 and 50.
EMAs:

SMAs:

Both

EMAs:
SMAs:
Both
ملاحظات الأخبار
Refined the default colour, to fit better for the light theme. Fixed two display bugs in the 0 and 6 MAs.ملاحظات الأخبار
* Easier control of the colours of Moving Averages.* Optionally draw a half-transparent borders of the channels.
ملاحظات الأخبار
Not showing low/high channels on price scale.ملاحظات الأخبار
Added a checkbox for the separate EMAs/SMAs channels. نص برمجي مفتوح المصدر
بروح TradingView الحقيقية، قام مبتكر هذا النص البرمجي بجعله مفتوح المصدر، بحيث يمكن للمتداولين مراجعة وظائفه والتحقق منها. شكرا للمؤلف! بينما يمكنك استخدامه مجانًا، تذكر أن إعادة نشر الكود يخضع لقواعد الموقع الخاصة بنا.
إخلاء المسؤولية
لا يُقصد بالمعلومات والمنشورات أن تكون، أو تشكل، أي نصيحة مالية أو استثمارية أو تجارية أو أنواع أخرى من النصائح أو التوصيات المقدمة أو المعتمدة من TradingView. اقرأ المزيد في شروط الاستخدام.
نص برمجي مفتوح المصدر
بروح TradingView الحقيقية، قام مبتكر هذا النص البرمجي بجعله مفتوح المصدر، بحيث يمكن للمتداولين مراجعة وظائفه والتحقق منها. شكرا للمؤلف! بينما يمكنك استخدامه مجانًا، تذكر أن إعادة نشر الكود يخضع لقواعد الموقع الخاصة بنا.
إخلاء المسؤولية
لا يُقصد بالمعلومات والمنشورات أن تكون، أو تشكل، أي نصيحة مالية أو استثمارية أو تجارية أو أنواع أخرى من النصائح أو التوصيات المقدمة أو المعتمدة من TradingView. اقرأ المزيد في شروط الاستخدام.