OPEN-SOURCE SCRIPT
3 EMA & SMA (Market Cycle)
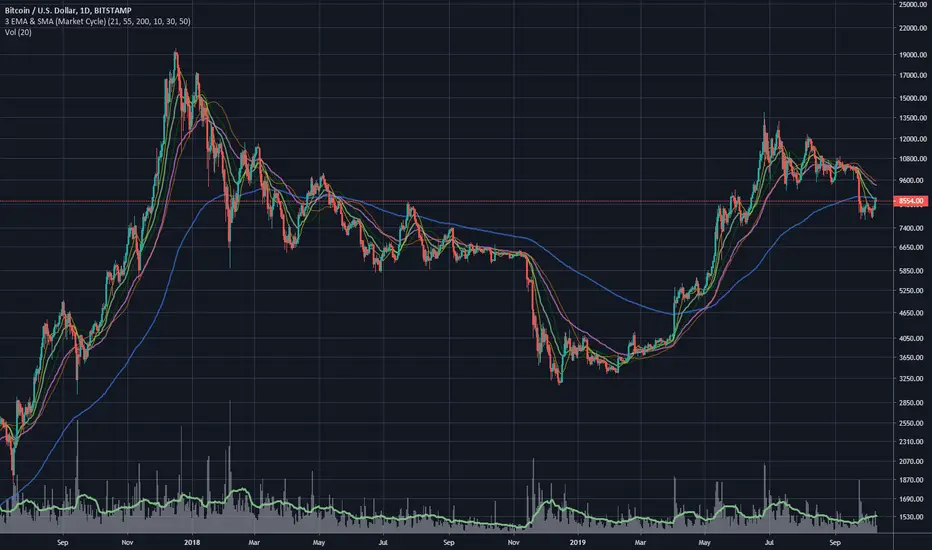
Simple Indicator based on 3 Simple and 3 Exponential Moving Averages. Used to indicate Market Cycles.
Definition of Bull Market: 10 SMA is above 21 EMA . 30 SMA slope is up. 55 EMA is trending above 200 EMA .
Definition of Bear Market: 10 SMA is below 21 EMA . 30 SMA slope is down. 55 EMA is trending below 200 EMA .
Definition of Bull Market: 10 SMA is above 21 EMA . 30 SMA slope is up. 55 EMA is trending above 200 EMA .
Definition of Bear Market: 10 SMA is below 21 EMA . 30 SMA slope is down. 55 EMA is trending below 200 EMA .
نص برمجي مفتوح المصدر
بروح TradingView الحقيقية، قام مبتكر هذا النص البرمجي بجعله مفتوح المصدر، بحيث يمكن للمتداولين مراجعة وظائفه والتحقق منها. شكرا للمؤلف! بينما يمكنك استخدامه مجانًا، تذكر أن إعادة نشر الكود يخضع لقواعد الموقع الخاصة بنا.
إخلاء المسؤولية
لا يُقصد بالمعلومات والمنشورات أن تكون، أو تشكل، أي نصيحة مالية أو استثمارية أو تجارية أو أنواع أخرى من النصائح أو التوصيات المقدمة أو المعتمدة من TradingView. اقرأ المزيد في شروط الاستخدام.