PROTECTED SOURCE SCRIPT
تم تحديثه 3 Period EMA Cloud [deepakks444]
3 Period EMA Cloud Indicator
The 3EMA Cloud Indicator uses three key EMAs to capture trends and display the market's direction through a color-coded cloud. The EMAs used in this indicator are:
High EMA: The EMA of the high prices over a specified period.
Low EMA: The EMA of the low prices over a specified period.
Additional EMA: An extra EMA, typically based on the close prices, that serves as an independent confirmation tool for trend direction.
Indicator Logic and Cloud Visualization:
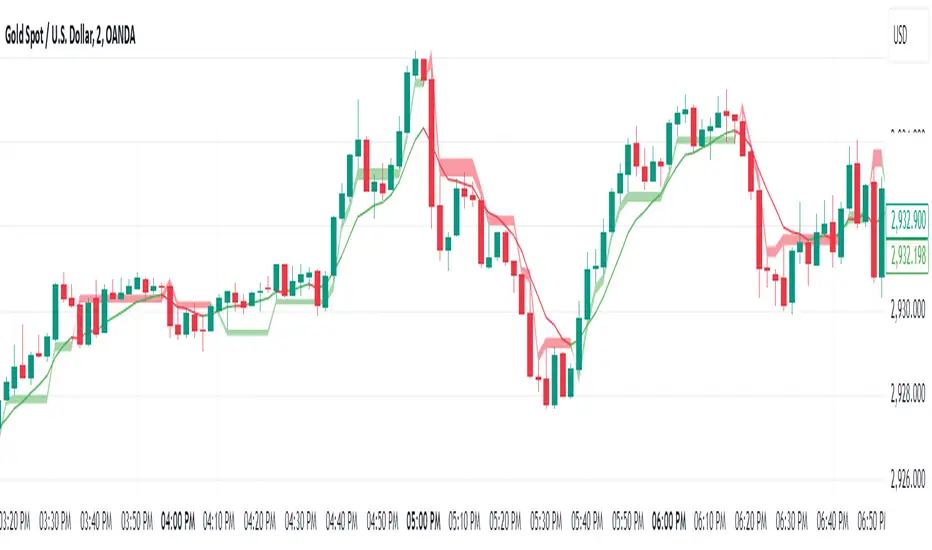
The cloud is drawn between the high EMA and the low EMA, and its color changes based on the price's relationship to the high EMA, low EMA, and additional EMA.
Cloud Color:
Green Cloud: When the price is above both the high EMA and the low EMA, it signals a bullish trend, and the cloud turns green.
Additionally, if the close price is above the Additional EMA, this further confirms the bullish trend.
Red Cloud: When the price is below both the high EMA and the low EMA, it signals a bearish trend, and the cloud turns red.
Additionally, if the close price is below the Additional EMA, this further confirms the bearish trend.
How the Indicator Captures Trends:
Bullish Market:
Price above both high EMA and low EMA: This indicates that the market is in an uptrend, and the cloud will turn green.
Confirmation with Additional EMA: When the close price is above the Additional EMA, this reinforces the bullish market sentiment.
The green cloud is the visual confirmation of a bullish trend, guiding traders to consider long positions.
Bearish Market:
Price below both high EMA and low EMA: This indicates that the market is in a downtrend, and the cloud will turn red.
Confirmation with Additional EMA: When the close price is below the Additional EMA, this confirms the bearish trend.
The red cloud is the visual confirmation of a bearish trend, guiding traders to consider short positions.
Key Components:
High EMA: Calculates the EMA based on high prices, which helps to determine the upper boundary of the cloud.
Low EMA: Calculates the EMA based on low prices, which helps to determine the lower boundary of the cloud.
Additional EMA: An extra EMA (often of the close prices) that acts as an independent trend confirmation. This is used to validate the market direction and filter out potential false signals.
Use Cases for the 3EMA Cloud:
Trend Identification:
The cloud helps to visually identify the prevailing trend. A green cloud suggests a bullish trend, while a red cloud indicates a bearish trend.
Confirmation Tool:
The Additional EMA serves as an additional confirmation tool. A close price above the Additional EMA signals a strong bullish trend, while a close below it signals a strong bearish trend.
Market Reversals:
When the price moves from above both the high EMA and low EMA to below them (or vice versa), this could indicate a trend reversal. Pay attention to cloud color changes and the movement of the close price relative to the Additional EMA for potential reversal signals.
Entry and Exit Signals:
Long Entry (Buy Signal):
Price is above both the high EMA and low EMA, confirming a bullish trend.
Close price is above the Additional EMA, confirming the bullish trend.
Enter a long position when the cloud turns green and the confirmation by the Additional EMA is in place.
Short Entry (Sell Signal):
Price is below both the high EMA and low EMA, confirming a bearish trend.
Close price is below the Additional EMA, confirming the bearish trend.
Enter a short position when the cloud turns red and the confirmation by the Additional EMA is in place.
Exit Signal:
Exit Long Position when the price moves below both the high EMA and low EMA (signaling a potential trend reversal), or if the close price falls below the Additional EMA.
Exit Short Position when the price moves above both the high EMA and low EMA (signaling a potential trend reversal), or if the close price rises above the Additional EMA.
How This Indicator Improves Trend Following:
The 3EMA Cloud indicator enhances trend-following strategies by:
Visual Clarity: The color-coded cloud provides immediate visual feedback on whether the market is in a bullish or bearish phase.
Price Confirmation: The indicator uses the relationship of price to three EMAs (high, low, and additional) to confirm trend strength, which can help reduce false signals.
Flexibility: The Additional EMA adds flexibility by serving as an independent confirmation tool for trend direction, ensuring that you don’t enter trades based on weak or choppy market conditions.
This 3EMA Cloud indicator is designed to help traders follow and confirm trends with precision, improving their ability to identify strong market movements and avoid getting caught in sideways or choppy conditions. It provides a clear visual cue for potential buy and sell opportunities based on price relative to multiple EMAs, ensuring that trend-following strategies are robust and effective.
Disclaimer:
This script and its associated indicators are for educational purposes only. The information provided does not constitute financial advice or a recommendation to buy or sell any financial instruments. Users are advised to conduct their own research and consult with a professional financial advisor before making any trading decisions. Trading and investing involve risk, and users should be aware of the risks involved in financial markets.
The 3EMA Cloud Indicator uses three key EMAs to capture trends and display the market's direction through a color-coded cloud. The EMAs used in this indicator are:
High EMA: The EMA of the high prices over a specified period.
Low EMA: The EMA of the low prices over a specified period.
Additional EMA: An extra EMA, typically based on the close prices, that serves as an independent confirmation tool for trend direction.
Indicator Logic and Cloud Visualization:
The cloud is drawn between the high EMA and the low EMA, and its color changes based on the price's relationship to the high EMA, low EMA, and additional EMA.
Cloud Color:
Green Cloud: When the price is above both the high EMA and the low EMA, it signals a bullish trend, and the cloud turns green.
Additionally, if the close price is above the Additional EMA, this further confirms the bullish trend.
Red Cloud: When the price is below both the high EMA and the low EMA, it signals a bearish trend, and the cloud turns red.
Additionally, if the close price is below the Additional EMA, this further confirms the bearish trend.
How the Indicator Captures Trends:
Bullish Market:
Price above both high EMA and low EMA: This indicates that the market is in an uptrend, and the cloud will turn green.
Confirmation with Additional EMA: When the close price is above the Additional EMA, this reinforces the bullish market sentiment.
The green cloud is the visual confirmation of a bullish trend, guiding traders to consider long positions.
Bearish Market:
Price below both high EMA and low EMA: This indicates that the market is in a downtrend, and the cloud will turn red.
Confirmation with Additional EMA: When the close price is below the Additional EMA, this confirms the bearish trend.
The red cloud is the visual confirmation of a bearish trend, guiding traders to consider short positions.
Key Components:
High EMA: Calculates the EMA based on high prices, which helps to determine the upper boundary of the cloud.
Low EMA: Calculates the EMA based on low prices, which helps to determine the lower boundary of the cloud.
Additional EMA: An extra EMA (often of the close prices) that acts as an independent trend confirmation. This is used to validate the market direction and filter out potential false signals.
Use Cases for the 3EMA Cloud:
Trend Identification:
The cloud helps to visually identify the prevailing trend. A green cloud suggests a bullish trend, while a red cloud indicates a bearish trend.
Confirmation Tool:
The Additional EMA serves as an additional confirmation tool. A close price above the Additional EMA signals a strong bullish trend, while a close below it signals a strong bearish trend.
Market Reversals:
When the price moves from above both the high EMA and low EMA to below them (or vice versa), this could indicate a trend reversal. Pay attention to cloud color changes and the movement of the close price relative to the Additional EMA for potential reversal signals.
Entry and Exit Signals:
Long Entry (Buy Signal):
Price is above both the high EMA and low EMA, confirming a bullish trend.
Close price is above the Additional EMA, confirming the bullish trend.
Enter a long position when the cloud turns green and the confirmation by the Additional EMA is in place.
Short Entry (Sell Signal):
Price is below both the high EMA and low EMA, confirming a bearish trend.
Close price is below the Additional EMA, confirming the bearish trend.
Enter a short position when the cloud turns red and the confirmation by the Additional EMA is in place.
Exit Signal:
Exit Long Position when the price moves below both the high EMA and low EMA (signaling a potential trend reversal), or if the close price falls below the Additional EMA.
Exit Short Position when the price moves above both the high EMA and low EMA (signaling a potential trend reversal), or if the close price rises above the Additional EMA.
How This Indicator Improves Trend Following:
The 3EMA Cloud indicator enhances trend-following strategies by:
Visual Clarity: The color-coded cloud provides immediate visual feedback on whether the market is in a bullish or bearish phase.
Price Confirmation: The indicator uses the relationship of price to three EMAs (high, low, and additional) to confirm trend strength, which can help reduce false signals.
Flexibility: The Additional EMA adds flexibility by serving as an independent confirmation tool for trend direction, ensuring that you don’t enter trades based on weak or choppy market conditions.
This 3EMA Cloud indicator is designed to help traders follow and confirm trends with precision, improving their ability to identify strong market movements and avoid getting caught in sideways or choppy conditions. It provides a clear visual cue for potential buy and sell opportunities based on price relative to multiple EMAs, ensuring that trend-following strategies are robust and effective.
Disclaimer:
This script and its associated indicators are for educational purposes only. The information provided does not constitute financial advice or a recommendation to buy or sell any financial instruments. Users are advised to conduct their own research and consult with a professional financial advisor before making any trading decisions. Trading and investing involve risk, and users should be aware of the risks involved in financial markets.
ملاحظات الأخبار
Cloud color will be based on 3 Period EMAs only. Where additional confirmation is there a symbol will mark the candle for entry.
ملاحظات الأخبار
Added input option to choose source of EMAs.ملاحظات الأخبار
3 Period EMA Cloud IndicatorThe 3EMA Cloud Indicator uses three key EMAs to capture trends and display the market's direction through a color-coded cloud. The EMAs used in this indicator are:
High EMA: The EMA of the high prices over a specified period.
Low EMA: The EMA of the low prices over a specified period.
Additional EMA: An extra EMA, typically based on the close prices, that serves as an independent confirmation tool for trend direction.
Indicator Logic and Cloud Visualization:
The cloud is drawn between the high EMA and the low EMA, and its color changes based on the price's relationship to the high EMA, low EMA, and additional EMA.
Cloud Color:
Green Cloud: When the price is above both the high EMA and the low EMA, it signals a bullish trend, and the cloud turns green.
Additionally, if the close price is above the Additional EMA, this further confirms the bullish trend.
Red Cloud: When the price is below both the high EMA and the low EMA, it signals a bearish trend, and the cloud turns red.
Additionally, if the close price is below the Additional EMA, this further confirms the bearish trend.
How the Indicator Captures Trends:
Bullish Market:
Price above both high EMA and low EMA: This indicates that the market is in an uptrend, and the cloud will turn green.
Confirmation with Additional EMA: When the close price is above the Additional EMA, this reinforces the bullish market sentiment.
The green cloud is the visual confirmation of a bullish trend, guiding traders to consider long positions.
Bearish Market:
Price below both high EMA and low EMA: This indicates that the market is in a downtrend, and the cloud will turn red.
Confirmation with Additional EMA: When the close price is below the Additional EMA, this confirms the bearish trend.
The red cloud is the visual confirmation of a bearish trend, guiding traders to consider short positions.
Key Components:
High EMA: Calculates the EMA based on high prices, which helps to determine the upper boundary of the cloud.
Low EMA: Calculates the EMA based on low prices, which helps to determine the lower boundary of the cloud.
Additional EMA: An extra EMA (often of the close prices) that acts as an independent trend confirmation. This is used to validate the market direction and filter out potential false signals.
Use Cases for the 3EMA Cloud:
Trend Identification:
The cloud helps to visually identify the prevailing trend. A green cloud suggests a bullish trend, while a red cloud indicates a bearish trend.
Confirmation Tool:
The Additional EMA serves as an additional confirmation tool. A close price above the Additional EMA signals a strong bullish trend, while a close below it signals a strong bearish trend.
Market Reversals:
When the price moves from above both the high EMA and low EMA to below them (or vice versa), this could indicate a trend reversal. Pay attention to cloud color changes and the movement of the close price relative to the Additional EMA for potential reversal signals.
Entry and Exit Signals:
Long Entry (Buy Signal):
Price is above both the high EMA and low EMA, confirming a bullish trend.
Close price is above the Additional EMA, confirming the bullish trend.
Enter a long position when the cloud turns green and the confirmation by the Additional EMA is in place.
Short Entry (Sell Signal):
Price is below both the high EMA and low EMA, confirming a bearish trend.
Close price is below the Additional EMA, confirming the bearish trend.
Enter a short position when the cloud turns red and the confirmation by the Additional EMA is in place.
Exit Signal:
Exit Long Position when the price moves below both the high EMA and low EMA (signaling a potential trend reversal), or if the close price falls below the Additional EMA.
Exit Short Position when the price moves above both the high EMA and low EMA (signaling a potential trend reversal), or if the close price rises above the Additional EMA.
How This Indicator Improves Trend Following:
The 3EMA Cloud indicator enhances trend-following strategies by:
Visual Clarity: The color-coded cloud provides immediate visual feedback on whether the market is in a bullish or bearish phase.
Price Confirmation: The indicator uses the relationship of price to three EMAs (high, low, and additional) to confirm trend strength, which can help reduce false signals.
Flexibility: The Additional EMA adds flexibility by serving as an independent confirmation tool for trend direction, ensuring that you don’t enter trades based on weak or choppy market conditions.
This 3EMA Cloud indicator is designed to help traders follow and confirm trends with precision, improving their ability to identify strong market movements and avoid getting caught in sideways or choppy conditions. It provides a clear visual cue for potential buy and sell opportunities based on price relative to multiple EMAs, ensuring that trend-following strategies are robust and effective.
Disclaimer:
This script and its associated indicators are for educational purposes only. The information provided does not constitute financial advice or a recommendation to buy or sell any financial instruments. Users are advised to conduct their own research and consult with a professional financial advisor before making any trading decisions. Trading and investing involve risk, and users should be aware of the risks involved in financial markets.
ملاحظات الأخبار
Minor updatesملاحظات الأخبار
Minor updateنص برمجي محمي
تم نشر هذا النص البرمجي كمصدر مغلق. ومع ذلك، يمكنك استخدامه بحرية ودون أي قيود - تعرف على المزيد هنا.
إخلاء المسؤولية
لا يُقصد بالمعلومات والمنشورات أن تكون، أو تشكل، أي نصيحة مالية أو استثمارية أو تجارية أو أنواع أخرى من النصائح أو التوصيات المقدمة أو المعتمدة من TradingView. اقرأ المزيد في شروط الاستخدام.
نص برمجي محمي
تم نشر هذا النص البرمجي كمصدر مغلق. ومع ذلك، يمكنك استخدامه بحرية ودون أي قيود - تعرف على المزيد هنا.
إخلاء المسؤولية
لا يُقصد بالمعلومات والمنشورات أن تكون، أو تشكل، أي نصيحة مالية أو استثمارية أو تجارية أو أنواع أخرى من النصائح أو التوصيات المقدمة أو المعتمدة من TradingView. اقرأ المزيد في شروط الاستخدام.