OPEN-SOURCE SCRIPT
تم تحديثه Parabolic sar with breaks

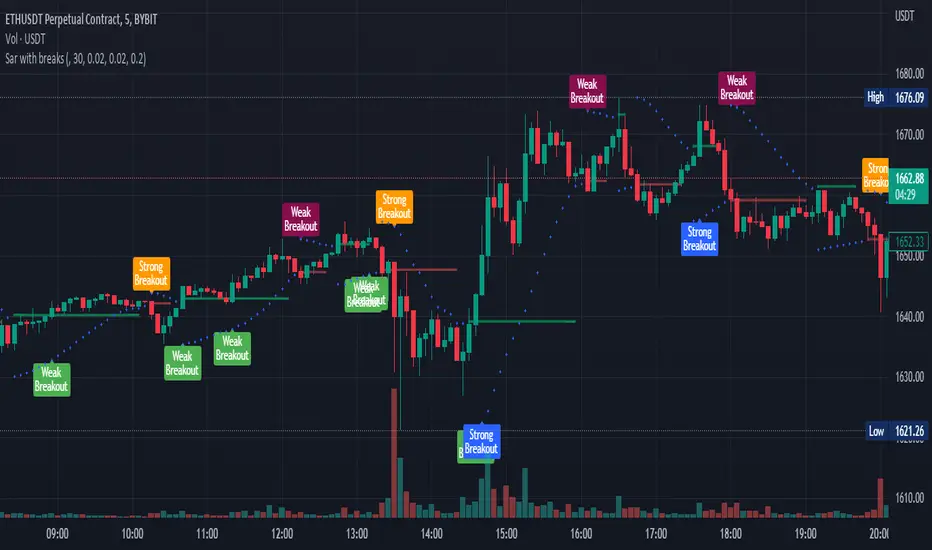
This plots a Parabolic sar and a break line on the previous sar point before the parabolic sar flips.
This is looking to be a very popular entry signal for lots of strats.
How to use:
In conjunction with other confirmation indicators;
Long: Enter long when the Parabolic sar is below the price and the price breaks above (and closes) the break line.
Short: Enter short when the Parabolic sar is above the price and the price breaks below (and closes) the break line.
A great indicator combination for this is to use a 200 ema for price trend and volume flow.
ملاحظات الأخبار
Added long and short labels that show when the psar line is broken with high volumeملاحظات الأخبار
Changed chartAdded check that labels should not show if the breaking candle has a long wick
ملاحظات الأخبار
removed wick check as it was buggyملاحظات الأخبار
Only show signals when parabolic sar is bullish/bearish.ملاحظات الأخبار
Selectable timeframeملاحظات الأخبار
Added alerts and changed breakout labels.After some research, I have found that when a parabolic Sar Breakout line is broken by price with high volume, it is much more likely to continue in that direction, and so I have have added strong and weak breakout labels.
You are able to show/hide them individually.
نص برمجي مفتوح المصدر
بروح TradingView الحقيقية، قام مبتكر هذا النص البرمجي بجعله مفتوح المصدر، بحيث يمكن للمتداولين مراجعة وظائفه والتحقق منها. شكرا للمؤلف! بينما يمكنك استخدامه مجانًا، تذكر أن إعادة نشر الكود يخضع لقواعد الموقع الخاصة بنا.
إخلاء المسؤولية
لا يُقصد بالمعلومات والمنشورات أن تكون، أو تشكل، أي نصيحة مالية أو استثمارية أو تجارية أو أنواع أخرى من النصائح أو التوصيات المقدمة أو المعتمدة من TradingView. اقرأ المزيد في شروط الاستخدام.