OPEN-SOURCE SCRIPT
تم تحديثه DJ Soori Trading Strategy

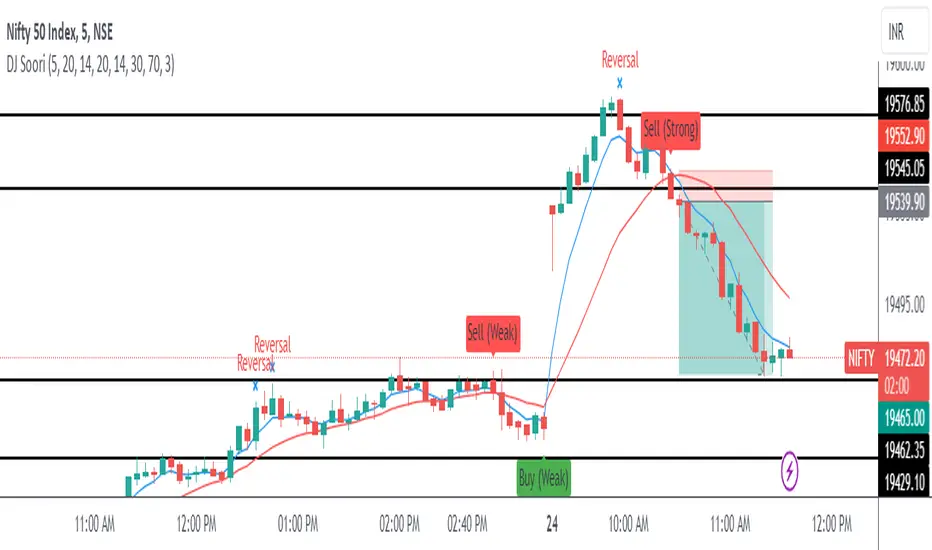
The strategy combines three indicators: Exponential Moving Average (EMA), Weighted Moving Average (WMA), and Average Directional Index (ADX).
The EMA and WMA are used to track the average price over different time periods.
The ADX measures the strength of a trend in the market.
The strategy generates buy signals when the EMA is higher than the WMA and the ADX is above a certain threshold. It suggests a potential uptrend.
It generates sell signals when the EMA is lower than the WMA and the ADX is above the threshold. It suggests a potential downtrend.
The strategy also considers whether the ADX is rising or falling to indicate the strength of the trend.
The EMA, WMA, and ADX values are plotted on the chart.
Buy and sell signals are shown as labels on the chart, indicating "Buy (Strong)" or "Buy (Weak)" for buy signals, and "Sell (Strong)" or "Sell (Weak)" for sell signals.
ملاحظات الأخبار
The strategy combines three indicators: Exponential Moving Average (EMA), Weighted Moving Average (WMA), and Average Directional Index (ADX).EMA and WMA track the average price over different time periods.
ADX measures the strength of a trend in the market.
Buy signals:
Generated when EMA is higher than WMA and ADX is above a threshold.
Indicates a potential uptrend.
Sell signals:
Generated when EMA is lower than WMA and ADX is above the threshold.
Indicates a potential downtrend.
The strategy considers the rising or falling nature of ADX to assess the strength of the trend.
The chart displays the EMA, WMA, and ADX values.
Buy and sell signals are indicated on the chart as labels:
"Buy (Strong)" or "Buy (Weak)" for buy signals.
"Sell (Strong)" or "Sell (Weak)" for sell signals.
This strategy helps identify potential trends and provides buy/sell signals based on the EMA-WMA crossover and ADX strength.
ملاحظات الأخبار
Updated barstate codes ملاحظات الأخبار
Book profit has been changed to reversal signملاحظات الأخبار
Some new changes added ملاحظات الأخبار
Updated EMA and WMAنص برمجي مفتوح المصدر
بروح TradingView الحقيقية، قام مبتكر هذا النص البرمجي بجعله مفتوح المصدر، بحيث يمكن للمتداولين مراجعة وظائفه والتحقق منها. شكرا للمؤلف! بينما يمكنك استخدامه مجانًا، تذكر أن إعادة نشر الكود يخضع لقواعد الموقع الخاصة بنا.
إخلاء المسؤولية
لا يُقصد بالمعلومات والمنشورات أن تكون، أو تشكل، أي نصيحة مالية أو استثمارية أو تجارية أو أنواع أخرى من النصائح أو التوصيات المقدمة أو المعتمدة من TradingView. اقرأ المزيد في شروط الاستخدام.
نص برمجي مفتوح المصدر
بروح TradingView الحقيقية، قام مبتكر هذا النص البرمجي بجعله مفتوح المصدر، بحيث يمكن للمتداولين مراجعة وظائفه والتحقق منها. شكرا للمؤلف! بينما يمكنك استخدامه مجانًا، تذكر أن إعادة نشر الكود يخضع لقواعد الموقع الخاصة بنا.
إخلاء المسؤولية
لا يُقصد بالمعلومات والمنشورات أن تكون، أو تشكل، أي نصيحة مالية أو استثمارية أو تجارية أو أنواع أخرى من النصائح أو التوصيات المقدمة أو المعتمدة من TradingView. اقرأ المزيد في شروط الاستخدام.