PROTECTED SOURCE SCRIPT
Yield Curve Analyzer - Market Radar
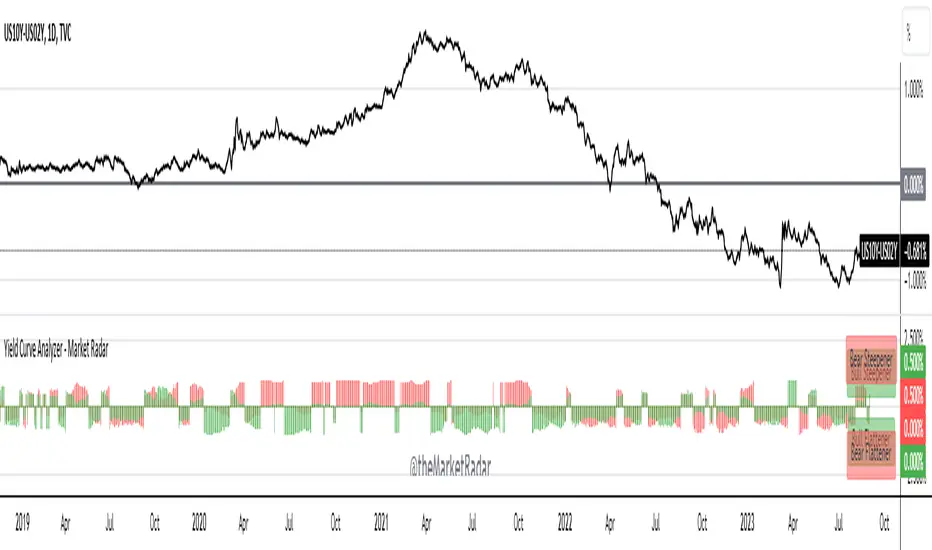
This is a script that gives insight into the types of moves that are happening across the yield curve. It helps in identifying both bull/bear steepeners and flatteners between two tenors.
The indicator displays data as a percentage of the steepeners and flatteners that have occurred over a short-term trailing window. This gives a reading that is more digestible with less noise.
Currently, the indicator only displays data for the 10Y-2Y US Treasury yield spread.
We intend to add additional spreads in the near future; such as 10Y-3M, 30Y-5Y, and 30Y-2Y.
نص برمجي محمي
تم نشر هذا النص البرمجي كمصدر مغلق. ومع ذلك، يمكنك استخدامه بحرية ودون أي قيود - تعرف على المزيد هنا.
إخلاء المسؤولية
لا يُقصد بالمعلومات والمنشورات أن تكون، أو تشكل، أي نصيحة مالية أو استثمارية أو تجارية أو أنواع أخرى من النصائح أو التوصيات المقدمة أو المعتمدة من TradingView. اقرأ المزيد في شروط الاستخدام.