PROTECTED SOURCE SCRIPT
M2 + Fed Funds con anotaciones históricas
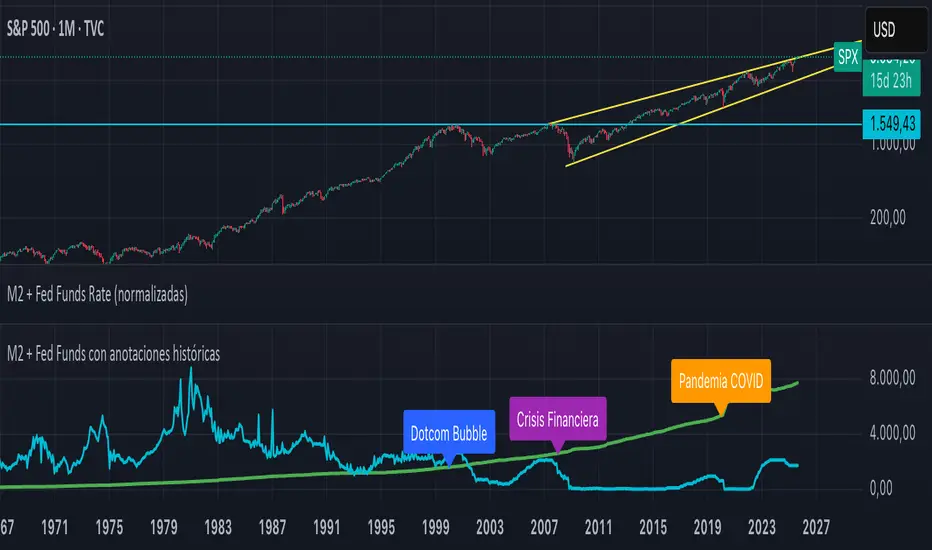
This TradingView indicator creates a separate panel that displays the historical evolution of M2 Money Stock (US) and the Federal Funds Rate, both normalized to a base of 100 for easier comparison. It highlights key historical events with annotations, including:
2000: Dotcom Bubble
2008: Global Financial Crisis
2020: COVID-19 Pandemic
The script allows users to visually analyze the relationship between monetary liquidity (M2) and interest rates, showing how changes in Fed policy correspond to major economic events and trends.
2000: Dotcom Bubble
2008: Global Financial Crisis
2020: COVID-19 Pandemic
The script allows users to visually analyze the relationship between monetary liquidity (M2) and interest rates, showing how changes in Fed policy correspond to major economic events and trends.
نص برمجي محمي
تم نشر هذا النص البرمجي كمصدر مغلق. ومع ذلك، يمكنك استخدامه بحرية ودون أي قيود - تعرف على المزيد هنا.
إخلاء المسؤولية
لا يُقصد بالمعلومات والمنشورات أن تكون، أو تشكل، أي نصيحة مالية أو استثمارية أو تجارية أو أنواع أخرى من النصائح أو التوصيات المقدمة أو المعتمدة من TradingView. اقرأ المزيد في شروط الاستخدام.