OPEN-SOURCE SCRIPT
تم تحديثه HTF Liquidity Dashboard [TFO]
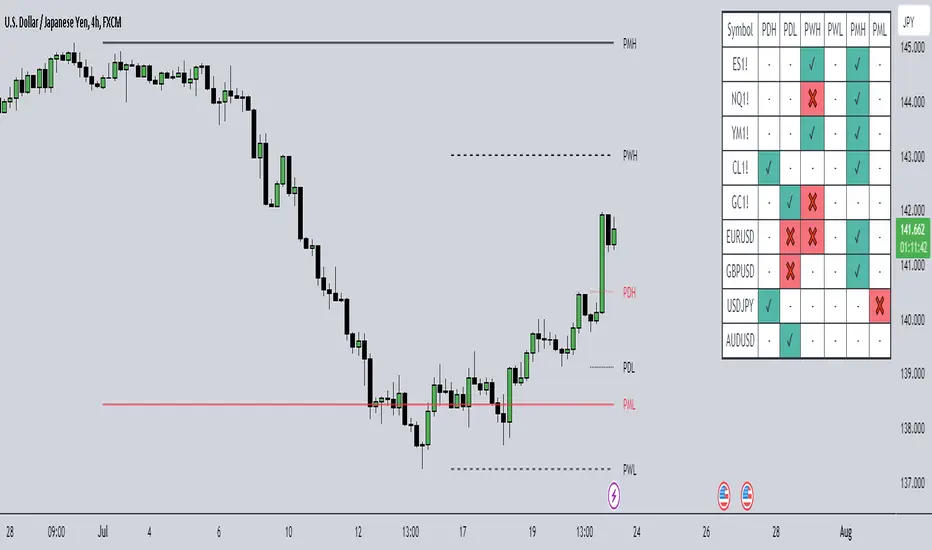
The purpose of this indicator is to server as a multi-symbol scanner that indicates when user-defined symbols have exceeded their previous Day/Week/Month highs and lows.

By default, the dashboard will use a compact view where the green ✔ means that price has swept and is currently exceeding the level of interest, the red ❌ implies that price swept the level but reversed back into the original range, and - indicates that the level hasn't been reached. However, the dashboard text can be toggled to show the numerical values of the highs and lows instead of these compact strings, as shown in the following image.

These levels may be shown and customized on the current chart as well via the Show Levels option. By default, levels from the selected timeframes will initially be plotted as black, and will change to red once traded through. Users can optionally increase the Session Limit parameter to show more than one previous high/low on their chart, for each selected timeframe.

Optionally, we can also plot labels to show when any of the user-defined symbols have exceeded their respective highs and lows, for any of the selected timeframes. Alerts can be created for these events as well; simply select the desired symbols and timeframes, create a new alert using this indicator, and you should be alerted when highs and lows are traded through. Note: if you encounter any issues with duplicate alerts, try deleting the alert, navigating to a lower timeframe such as the 1m, and making a new alert.

By default, the dashboard will use a compact view where the green ✔ means that price has swept and is currently exceeding the level of interest, the red ❌ implies that price swept the level but reversed back into the original range, and - indicates that the level hasn't been reached. However, the dashboard text can be toggled to show the numerical values of the highs and lows instead of these compact strings, as shown in the following image.
These levels may be shown and customized on the current chart as well via the Show Levels option. By default, levels from the selected timeframes will initially be plotted as black, and will change to red once traded through. Users can optionally increase the Session Limit parameter to show more than one previous high/low on their chart, for each selected timeframe.
Optionally, we can also plot labels to show when any of the user-defined symbols have exceeded their respective highs and lows, for any of the selected timeframes. Alerts can be created for these events as well; simply select the desired symbols and timeframes, create a new alert using this indicator, and you should be alerted when highs and lows are traded through. Note: if you encounter any issues with duplicate alerts, try deleting the alert, navigating to a lower timeframe such as the 1m, and making a new alert.
ملاحظات الأخبار
Fixed an issue that resulted from very low timeframes not being able to pull certain HTF dataملاحظات الأخبار
Applied global text size parameter to sweep labelsنص برمجي مفتوح المصدر
بروح TradingView الحقيقية، قام مبتكر هذا النص البرمجي بجعله مفتوح المصدر، بحيث يمكن للمتداولين مراجعة وظائفه والتحقق منها. شكرا للمؤلف! بينما يمكنك استخدامه مجانًا، تذكر أن إعادة نشر الكود يخضع لقواعد الموقع الخاصة بنا.
إخلاء المسؤولية
لا يُقصد بالمعلومات والمنشورات أن تكون، أو تشكل، أي نصيحة مالية أو استثمارية أو تجارية أو أنواع أخرى من النصائح أو التوصيات المقدمة أو المعتمدة من TradingView. اقرأ المزيد في شروط الاستخدام.
نص برمجي مفتوح المصدر
بروح TradingView الحقيقية، قام مبتكر هذا النص البرمجي بجعله مفتوح المصدر، بحيث يمكن للمتداولين مراجعة وظائفه والتحقق منها. شكرا للمؤلف! بينما يمكنك استخدامه مجانًا، تذكر أن إعادة نشر الكود يخضع لقواعد الموقع الخاصة بنا.
إخلاء المسؤولية
لا يُقصد بالمعلومات والمنشورات أن تكون، أو تشكل، أي نصيحة مالية أو استثمارية أو تجارية أو أنواع أخرى من النصائح أو التوصيات المقدمة أو المعتمدة من TradingView. اقرأ المزيد في شروط الاستخدام.