PROTECTED SOURCE SCRIPT
تم تحديثه 📊 Monitor F&M - RLYON
SCRIPT OBJECTIVE
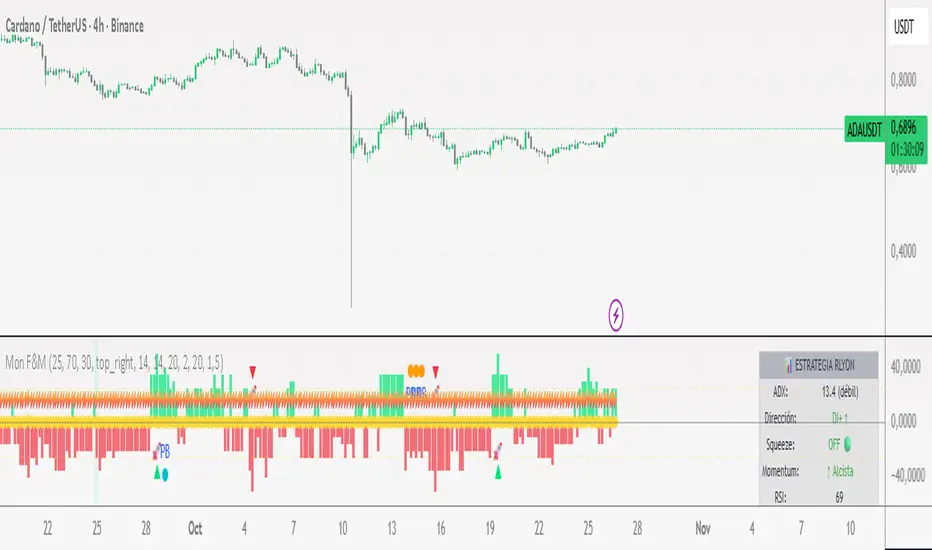
It's a confluence system that combines four key indicators to identify high-probability trading setups. It basically tells you when and where to enter the market with greater confidence.
🔧 THE 4 BASE INDICATORS
1. ADX (Average Directional Index)
What it measures: The strength of the trend (not the direction)
How to use it:
ADX ≥ 25 = STRONG trend ✅
ADX < 25 = Weak or sideways trend
What it does: Filters trades. You only look for entries when there is real strength in the market.
2. DI+ and DI- (Directional Indicators)
What it measures: The direction of the trend.
How to use it:
DI+ > DI- = Bullish trend 📈
DI- > DI+ = Bearish trend 📉
What it does: Defines whether you are looking for buys or sells.
3. TTM Squeeze (Bollinger Bands + Keltner Channels)
What it measures: Volatility compression and explosion.
States:
Squeeze ON 🔴: Volatility compressed (like a tightened spring).
Squeeze OFF 🟢: Volatility released (the spring is released = strong movement).
Transition 🔵: Changing state.
Momentum: The green/red histogram shows the direction of the movement.
Green rising = Strong bullish trend.
Red falling = Strong bearish trend.
4. RSI (Relative Strength Index)
What it measures: Whether the price is overbought or oversold.
Zones:
RSI > 70 = Overbought ⚠️ (be careful with purchases)
RSI < 30 = Oversold ✅ (bullish opportunity zone)
RSI 40-60 = Neutral zone/ideal for pullbacks
🎯 THE 2 MAIN STRATEGIES
STRATEGY 1: MOMENTUM (The strongest) 🚀
BUY setup:
✅ Squeeze released (changed from ON to OFF)
✅ Momentum green AND growing
✅ ADX ≥ 25 (strong trend)
✅ RSI not overbought (< 70)
SELL setup:
✅ Squeeze released (changed from ON to OFF)
✅ Momentum red AND Decreasing
✅ ADX ≥ 25 (strong trend)
✅ RSI not oversold (> 30)
When to trade: When you see the triangle 🚀 on the chart
STRATEGY 2: PULLBACK (Established trend) 📈📉
BUY setup:
✅ DI+ > DI- (established uptrend)
✅ ADX ≥ 25 (strong trend)
✅ RSI between 40-55 (healthy pullback)
✅ Momentum starting to turn upward
SELL setup:
✅ DI- > DI+ (established downtrend)
✅ ADX ≥ 25 (strong trend)
✅ RSI between 45-60 (healthy pullback)
✅ Momentum starting to turn downward
When to trade: When you see the "PB" circle in the graph
ملاحظات الأخبار
mejorada la calidad del panel informativoنص برمجي محمي
تم نشر هذا النص البرمجي كمصدر مغلق. ومع ذلك، يمكنك استخدامه بحرية ودون أي قيود - تعرف على المزيد هنا.
إخلاء المسؤولية
لا يُقصد بالمعلومات والمنشورات أن تكون، أو تشكل، أي نصيحة مالية أو استثمارية أو تجارية أو أنواع أخرى من النصائح أو التوصيات المقدمة أو المعتمدة من TradingView. اقرأ المزيد في شروط الاستخدام.
نص برمجي محمي
تم نشر هذا النص البرمجي كمصدر مغلق. ومع ذلك، يمكنك استخدامه بحرية ودون أي قيود - تعرف على المزيد هنا.
إخلاء المسؤولية
لا يُقصد بالمعلومات والمنشورات أن تكون، أو تشكل، أي نصيحة مالية أو استثمارية أو تجارية أو أنواع أخرى من النصائح أو التوصيات المقدمة أو المعتمدة من TradingView. اقرأ المزيد في شروط الاستخدام.