OPEN-SOURCE SCRIPT
Double RSI 00 1.0

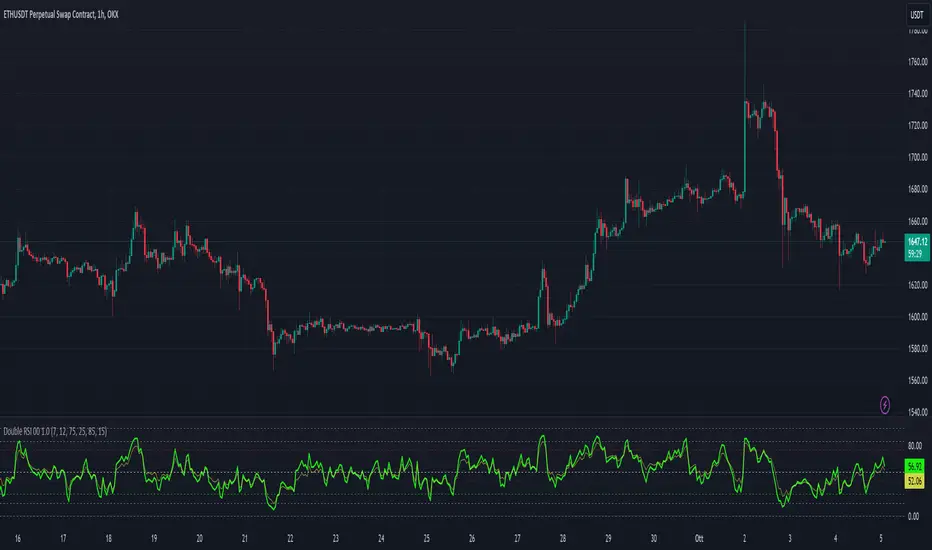
This script creates a custom indicator, visualizes two RSI values (RSI1 and RSI2) on the chart and generates alerts based on different RSI-related conditions, which can be used for technical analysis and trading strategies. Users can customize the RSI parameters and alert levels according to their preferences.
It includes several input parameters that allow the user to customize the RSI calculations and overbought/oversold levels. These parameters include:
length_1: RSI1 Length (default: 7)
length_2: RSI2 Length (default: 12)
overbought_1: Overbought Signal level for RSI1 (default: 75)
oversold_1: Oversold Signal level for RSI1 (default: 25)
overbought_2: High Overbought Signal level for RSI1 (default: 85)
oversold_2: High Oversold Signal level for RSI1 (default: 15)
The script calculates two RSI values: rsi_1 and rsi_2, based on the high and low prices averaged (hl2) and the specified RSI lengths.
It plots these RSI values on the chart using different colors and line widths.
Several horizontal lines are drawn on the chart to represent key levels:
h0: 0 (Lower Band)
h1: 50 (Middle Band)
h2: 100 (Upper Band)
h3: The Oversold level (customizable)
h4: The Overbought level (customizable)
h5: The High Oversold level (customizable)
h6: The High Overbought level (customizable)
The script defines alert conditions for various signals, including overbought, oversold, high overbought, high oversold, long (crossover between RSI1 and RSI2), and short (crossunder between RSI1 and RSI2).
It sends alerts when these conditions are met, indicating potential trading signals.
Please note that this script is meant for educational purposes and should be used cautiously in a real trading environment. It's important to have a thorough understanding of technical analysis and risk management when using such indicators in actual trading.
نص برمجي مفتوح المصدر
بروح TradingView الحقيقية، قام مبتكر هذا النص البرمجي بجعله مفتوح المصدر، بحيث يمكن للمتداولين مراجعة وظائفه والتحقق منها. شكرا للمؤلف! بينما يمكنك استخدامه مجانًا، تذكر أن إعادة نشر الكود يخضع لقواعد الموقع الخاصة بنا.
إخلاء المسؤولية
لا يُقصد بالمعلومات والمنشورات أن تكون، أو تشكل، أي نصيحة مالية أو استثمارية أو تجارية أو أنواع أخرى من النصائح أو التوصيات المقدمة أو المعتمدة من TradingView. اقرأ المزيد في شروط الاستخدام.