PROTECTED SOURCE SCRIPT
تم تحديثه structure break indicator
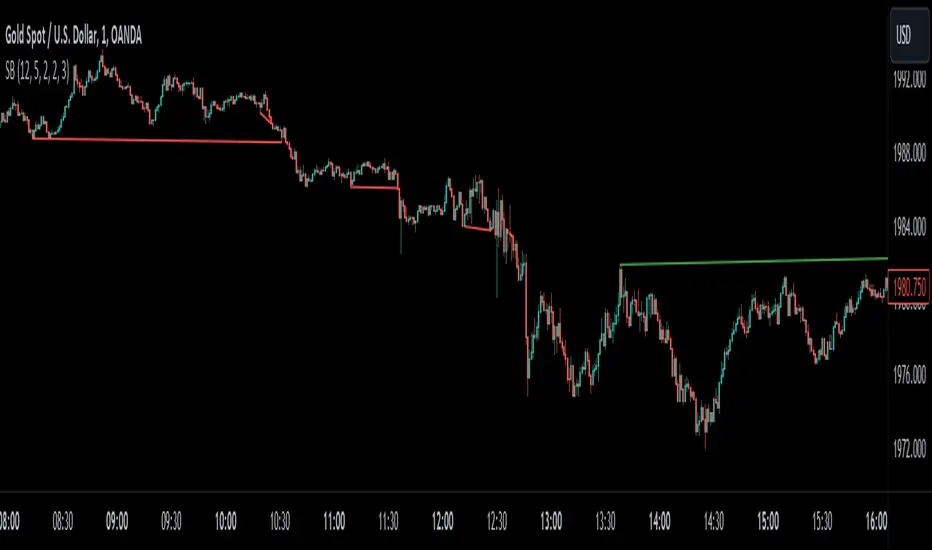
This indicator captures the beginning of a new trend or a correction. If higher highs are formed and the current low breaks the previous low, that means that a downward trend or correction is just beginning. Whereas if there are lower lows and the current high breaks the previous high, an upward trend or correction started. This uses the zigzag indicator made by DevLucem to check if highs and lows are broken or not. In the settings of this indicator you can change the colors of the lines, change the zigzag indicator's settings and choose to see the zigzag lines on your chart. Red colored lines are for bearish breaks and Green colored lines are for bullish breaks.
ملاحظات الأخبار
I changed the colors of the bearish and bullish structure breaks to make it visually easy to see. Red lines signal that a downtrend just started and green lines signal that an uptrend just startedملاحظات الأخبار
I changed the settings for the bullish and bearish breaksملاحظات الأخبار
I added alerts. The alert for an upward break is "🟢 Bullish break!" and "🔴 Bearish break!" for a downward break.Let me know if you want me to add something else!
نص برمجي محمي
تم نشر هذا النص البرمجي كمصدر مغلق. ومع ذلك، يمكنك استخدامه بحرية ودون أي قيود - تعرف على المزيد هنا.
إخلاء المسؤولية
لا يُقصد بالمعلومات والمنشورات أن تكون، أو تشكل، أي نصيحة مالية أو استثمارية أو تجارية أو أنواع أخرى من النصائح أو التوصيات المقدمة أو المعتمدة من TradingView. اقرأ المزيد في شروط الاستخدام.