OPEN-SOURCE SCRIPT
تم تحديثه P2-V2 - BTC Strategy
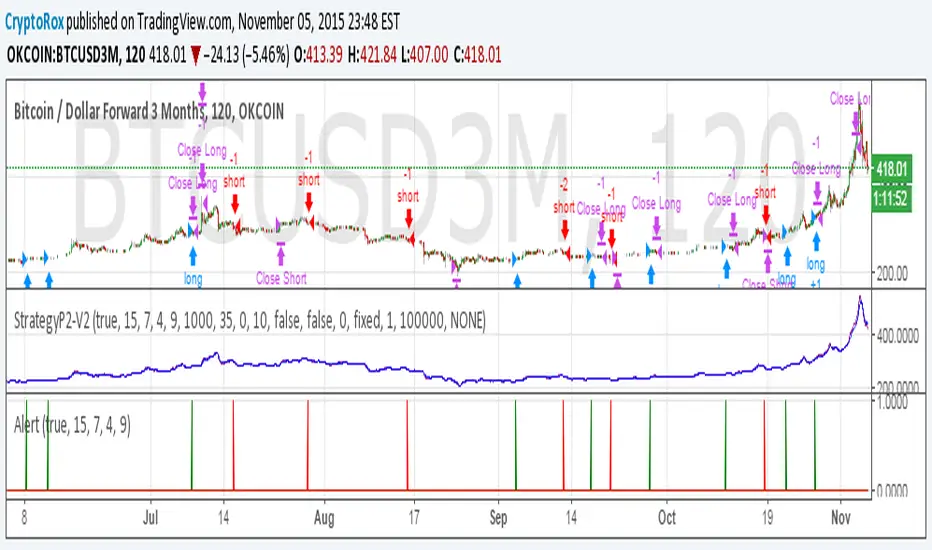
P2-V2 also known as Penner2.0 began with a TEMA and MA cross on Heiken Ashi, a strategy brought to us by a group of crypto traders. Since then we've added a few more indicators and played around with the rules.
This is an early release as I have yet to go through the full automation aspect, however, I know some of you would like to see where it's at.
If you'd like to learn how to automate a full strategy using the Chrome Extension, go to the linked idea for a eurusd setup.
This is an early release as I have yet to go through the full automation aspect, however, I know some of you would like to see where it's at.
If you'd like to learn how to automate a full strategy using the Chrome Extension, go to the linked idea for a eurusd setup.
ملاحظة
Alert Script://version=2
study("P2-V2", shorttitle="Alerts", overlay=false)
//Heiken Ashi Candles
Factor = 3
Pd = 7
isHA = input(true, "HA Candles", bool)
data = isHA ? heikenashi(tickerid) : tickerid
o = security(data, period, open)
h = security(data, period, high)
l = security(data, period, low)
c = security(data, period, close)
//Triple EMA
temaLength = input(15, minval=1)
ema1 = ema(c, temaLength)
ema2 = ema(ema1, temaLength)
ema3 = ema(ema2, temaLength)
tema = 3 * (ema1 - ema2) + ema3
//Moving Average
smaLength = input(7, minval=1)
sma = sma(c, smaLength)
//RSI
src = c
rsiLength = input(4, minval=1, title="Length")
up = rma(max(change(src), 0), rsiLength)
down = rma(-min(change(src), 0), rsiLength)
rsi = down == 0 ? 100 : up == 0 ? 0 : 100 - (100 / (1 + up / down))
rsin= input(9)
sn = 100 - rsin
ln = 0 + rsin
//Strategy
gc = c > o ? 1 : 0
rc = c < o ? 1 : 0
long = crossover(tema[2], sma[2]) and gc[1] == 1 and gc == 1 and rsi > sn
short = crossunder(tema[2], sma[2]) and rc[1] == 1 and rc == 1 and rsi < ln
plot(long, "long", color=green)
plot(short, "short", color=red)
ملاحظة
The above alert script did not copy/paste properly and is getting an error, to avoid clutter, just replace the bottom section @ //Strategy//Strategy
gc = c > o ? 1 : 0
rc = c < o ? 1 : 0
long = crossover(tema[2], sma[2]) and gc[1] == 1 and gc == 1 and rsi > sn
short = crossunder(tema[2], sma[2]) and rc[1] == 1 and rc == 1 and rsi < ln
plot(long, "long", color=green)
plot(short, "short", color=red)
ملاحظة
Let's try this again...//Strategy
gc = c > o ? 1 : 0
rc = c < o ? 1 : 0
long = crossover(tema[2], sma[2]) and gc[1] == 1 and gc == 1 and rsi > sn
short = crossunder(tema[2], sma[2]) and rc[1] == 1 and rc == 1 and rsi < ln
plot(long, "long", color=green)
plot(short, "short", color=red)
ملاحظة
Apologies for all the updates, not sure why pasting that section in here becomes corrupt, so instead I simply published the alert script here:
ملاحظة
All orders are now being tracked in a Google Sheet for public viewing. Since: 08/12/2014 07:00:00
Net Profit = $644.58 in BTC value
Link for tracked statistics here:
bit.ly/1SMvGVu
ملاحظة
To avoid repainting, this code needs to be adjusted. Results actually improve once the issue is corrected.On line 11 - 14 you'll see this...
o = security(data, period, open)
h = security(data, period, high)
l = security(data, period, low)
c = security(data, period, close)
we need to actually use the previous candle to avoid repainting, so just add a 1 candle look back.
square brackets 1 after the words "open, high, low, close"
TV does not let me paste the brackets, but you can see on line 12-16 of this strategy here what is needed.
![[AutoView] Automate it -Heiken Ashi, No pyramiding or repainting](https://s3.tradingview.com/w/wEZWjpGY_mid.png)
Hope this makes sense. Good luck.
ملاحظات الأخبار
Updated to Pinescript version 3 and added the new standard components.نص برمجي مفتوح المصدر
بروح TradingView الحقيقية، قام مبتكر هذا النص البرمجي بجعله مفتوح المصدر، بحيث يمكن للمتداولين مراجعة وظائفه والتحقق منها. شكرا للمؤلف! بينما يمكنك استخدامه مجانًا، تذكر أن إعادة نشر الكود يخضع لقواعد الموقع الخاصة بنا.
إخلاء المسؤولية
لا يُقصد بالمعلومات والمنشورات أن تكون، أو تشكل، أي نصيحة مالية أو استثمارية أو تجارية أو أنواع أخرى من النصائح أو التوصيات المقدمة أو المعتمدة من TradingView. اقرأ المزيد في شروط الاستخدام.
نص برمجي مفتوح المصدر
بروح TradingView الحقيقية، قام مبتكر هذا النص البرمجي بجعله مفتوح المصدر، بحيث يمكن للمتداولين مراجعة وظائفه والتحقق منها. شكرا للمؤلف! بينما يمكنك استخدامه مجانًا، تذكر أن إعادة نشر الكود يخضع لقواعد الموقع الخاصة بنا.
إخلاء المسؤولية
لا يُقصد بالمعلومات والمنشورات أن تكون، أو تشكل، أي نصيحة مالية أو استثمارية أو تجارية أو أنواع أخرى من النصائح أو التوصيات المقدمة أو المعتمدة من TradingView. اقرأ المزيد في شروط الاستخدام.