OPEN-SOURCE SCRIPT
Rally Sequences

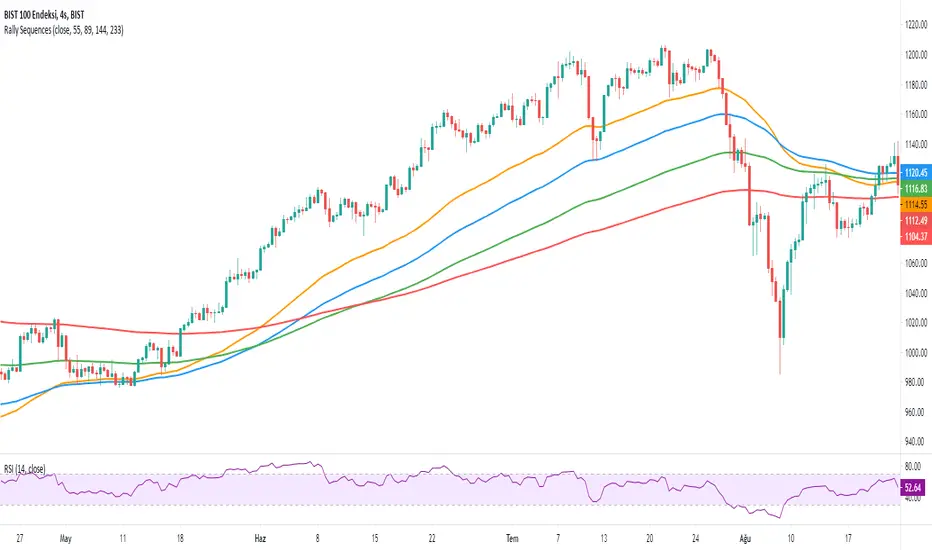
Another simple indicator that you can use to get to know the major trends and bull markets. It only uses 4 different exponential moving averages. These are (55, 89, 144, 233)
The correct alignment you should see on the screen should be from top to bottom and from small to large.
Example: 55 should be at the top and 89, 144 and 233 below, respectively. When you see this sequence, it is simple to realize that you are in a major rising trend.
Monthly, weekly, daily and 4-hour periods are ideal. Less than 4 hours, deviations are possible.
نص برمجي مفتوح المصدر
بروح TradingView الحقيقية، قام مبتكر هذا النص البرمجي بجعله مفتوح المصدر، بحيث يمكن للمتداولين مراجعة وظائفه والتحقق منها. شكرا للمؤلف! بينما يمكنك استخدامه مجانًا، تذكر أن إعادة نشر الكود يخضع لقواعد الموقع الخاصة بنا.
إخلاء المسؤولية
لا يُقصد بالمعلومات والمنشورات أن تكون، أو تشكل، أي نصيحة مالية أو استثمارية أو تجارية أو أنواع أخرى من النصائح أو التوصيات المقدمة أو المعتمدة من TradingView. اقرأ المزيد في شروط الاستخدام.