OPEN-SOURCE SCRIPT
تم تحديثه Index of Civilization Development
Index of Civilization Development Indicator
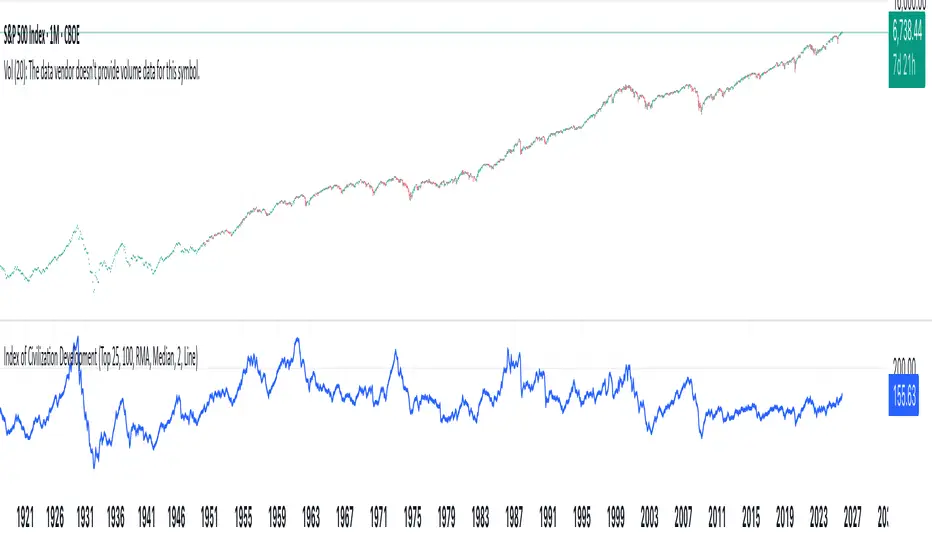
This Pine Script (version 6) creates a custom technical indicator for TradingView, titled Index of Civilization Development. It generates a composite index by averaging normalized stock market performances from a selection of global country indices. The normalization is relative to each index's 100-period simple moving average (SMA), scaled to a percentage (100% baseline). This allows for a comparable "development" or performance metric across diverse markets, potentially highlighting trends in global economic or "civilizational" progress based on equity markets.The indicator plots as a single line in a separate pane (non-overlay) and is designed to handle up to 40 symbols to respect TradingView's request.security() call limits.Key FeaturesComposite Index Calculation: Fetches the previous bar's close (close[1]) and its 100-period SMA for each selected symbol.
Normalizes each: (close[1] / SMA(100)) * 100.
Averages the valid normalizations (ignores invalid/NA data) to produce a single "Index (%)" value.
Symbol Selection Modes:Top N Countries: Selects from a predefined list of the top 50 global stock indices (by market cap/importance, e.g., SPX for USA, SHCOMP for China). Options: Top 5, 15, 25, or 50.
Democratic Countries: ~38 symbols from democracies (e.g., SPX, NI225, NIFTY; based on democracy indices ≥6/10, including flawed/parliamentary systems).
Dictatorships: ~12 symbols from authoritarian/hybrid regimes (e.g., SHCOMP, TASI, IMOEX; scores <6/10).
Customization:Line color (default: blue).
Line width (1-5, default: 2).
Line style: Solid line (default), Stepline, or Circles.
Data Handling:Uses request.security() with lookahead enabled for real-time accuracy, gaps off, and invalid symbol ignoring.
Runs calculations on every bar, with max_bars_back=2000 for historical depth.
Arrays are populated only on the first bar (barstate.isfirst) for efficiency.
Predefined Symbol Lists (Examples)Top 50: SPX (USA), SHCOMP (China), NI225 (Japan), ..., BAX (Bahrain).
Democratic: Focuses on free-market democracies like USA, Japan, UK, Canada, EU nations, Australia, etc.
Dictatorships: Authoritarian markets like China, Saudi Arabia, Russia, Turkey, etc.
Usage TipsAdd to any chart (e.g., daily/weekly timeframe) to view the composite line.
Ideal for macro analysis: Compare democratic vs. authoritarian performance, or track "top world" equity health.
Potential Limitations: Relies on TradingView's symbol availability; some exotic indices (e.g., KWSEIDX) may fail if not supported. The 40-symbol cap prevents errors.
Interpretation: Values >100 indicate above-trend performance; <100 suggest underperformance relative to recent averages.
This script blends financial data with geopolitical categorization for a unique "civilization index" perspective on global markets. For modifications, ensure symbol tickers match TradingView's format.
ملاحظات الأخبار
v1.1: Fixed inputsملاحظات الأخبار
v1.2: Fixed inputsنص برمجي مفتوح المصدر
بروح TradingView الحقيقية، قام مبتكر هذا النص البرمجي بجعله مفتوح المصدر، بحيث يمكن للمتداولين مراجعة وظائفه والتحقق منها. شكرا للمؤلف! بينما يمكنك استخدامه مجانًا، تذكر أن إعادة نشر الكود يخضع لقواعد الموقع الخاصة بنا.
إخلاء المسؤولية
لا يُقصد بالمعلومات والمنشورات أن تكون، أو تشكل، أي نصيحة مالية أو استثمارية أو تجارية أو أنواع أخرى من النصائح أو التوصيات المقدمة أو المعتمدة من TradingView. اقرأ المزيد في شروط الاستخدام.
نص برمجي مفتوح المصدر
بروح TradingView الحقيقية، قام مبتكر هذا النص البرمجي بجعله مفتوح المصدر، بحيث يمكن للمتداولين مراجعة وظائفه والتحقق منها. شكرا للمؤلف! بينما يمكنك استخدامه مجانًا، تذكر أن إعادة نشر الكود يخضع لقواعد الموقع الخاصة بنا.
إخلاء المسؤولية
لا يُقصد بالمعلومات والمنشورات أن تكون، أو تشكل، أي نصيحة مالية أو استثمارية أو تجارية أو أنواع أخرى من النصائح أو التوصيات المقدمة أو المعتمدة من TradingView. اقرأ المزيد في شروط الاستخدام.