PROTECTED SOURCE SCRIPT
تم تحديثه CVDD + Terminal Price Indicator + Z-SCORE
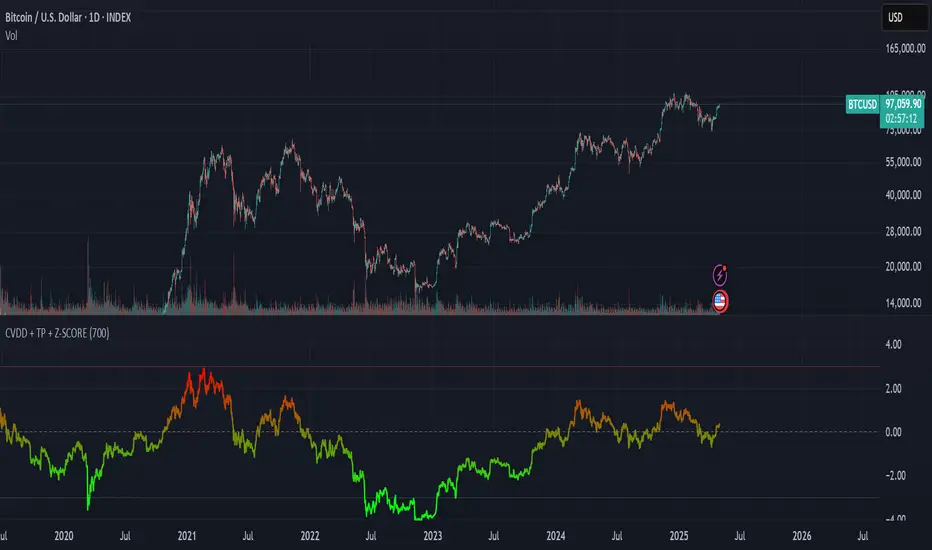
This custom indicator is designed to help identify major overvaluation and undervaluation zones in Bitcoin's market cycles by analyzing price behavior relative to long-term on-chain benchmarks.
It leverages two well-known valuation models — CVDD (Cumulative Value Days Destroyed) and Terminal Price — to define a dynamic valuation range that adapts over time. These reference points are combined with a custom Z-score framework to evaluate how extended price is compared to long-term value zones.
The result is a normalized oscillator that highlights extremes in market sentiment, ranging from –3 (potential deep value) to +3 (potential overheated conditions), with a gradient color scale for quick visual interpretation.
This tool is especially useful for long-term investors and macro analysts seeking signals of potential market tops and bottoms based on deep on-chain behavior — rather than short-term technicals.
ملاحظات الأخبار
This custom indicator is designed to help identify major overvaluation and undervaluation zones in Bitcoin's market cycles by analyzing price behavior relative to long-term on-chain benchmarks.It leverages two well-known valuation models — CVDD (Cumulative Value Days Destroyed) and Terminal Price — to define a dynamic valuation range that adapts over time. These reference points are combined with a custom Z-score framework to evaluate how extended price is compared to long-term value zones.
The result is a normalized oscillator that highlights extremes in market sentiment, ranging from –3 (potential deep value) to +3 (potential overheated conditions), with a gradient color scale for quick visual interpretation.
This tool is especially useful for long-term investors and macro analysts seeking signals of potential market tops and bottoms based on deep on-chain behavior — rather than short-term technicals.
نص برمجي محمي
تم نشر هذا النص البرمجي كمصدر مغلق. ومع ذلك، يمكنك استخدامه بحرية ودون أي قيود - تعرف على المزيد هنا.
إخلاء المسؤولية
لا يُقصد بالمعلومات والمنشورات أن تكون، أو تشكل، أي نصيحة مالية أو استثمارية أو تجارية أو أنواع أخرى من النصائح أو التوصيات المقدمة أو المعتمدة من TradingView. اقرأ المزيد في شروط الاستخدام.