OPEN-SOURCE SCRIPT
تم تحديثه ORB-5Min + Adaptive 12/48 EMA + PDH/PDL
Overview:
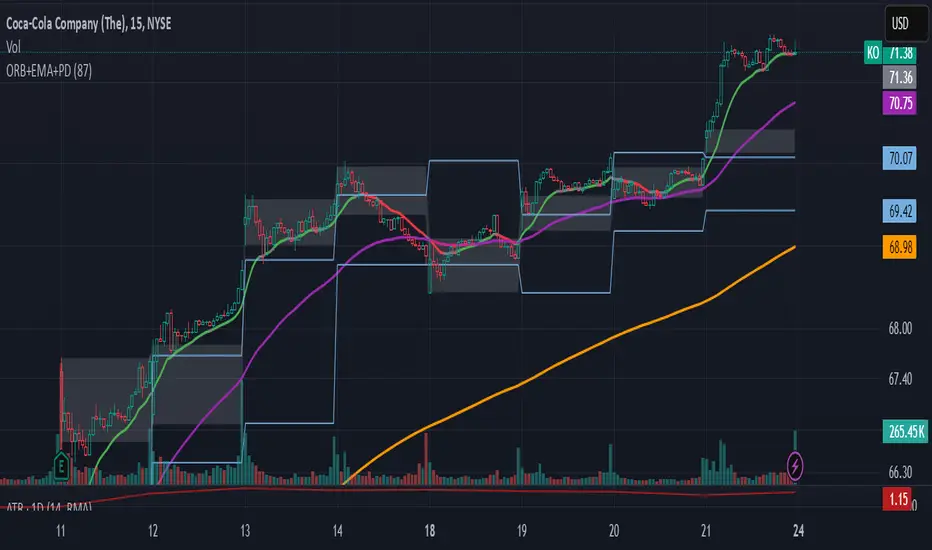
This indicator combines the 5-Minute Opening Range Breakout (ORB), Adaptive 12/48 Exponential Moving Averages (EMAs), and Previous Day High/Low (PDH/PDL) levels to help traders identify key intraday levels and market trends.
Key Components and Logic:
5-Minute Opening Range Breakout (ORB):
- Displays the high and low from the first 5-minute candle of the trading session.
- Includes customizable opacity for the range fill.
- Helps traders spot breakout opportunities and key support/resistance zones.
Adaptive 12/48 EMA System:
- Displays EMAs for 9, 12, 48, and 200 periods.
- The 12 EMA changes color based on whether the price is entirely above or below it.
- The 48 EMA changes color depending on its relationship with the 12 EMA.
- Provides dynamic trend identification and potential entry/exit signals.
Previous Day High/Low (PDH/PDL):
- Displays the previous day’s high and low levels.
- Useful for tracking key intraday support/resistance levels and potential reversal points.
Summary:
This script stands out by blending three popular intraday tools into a single comprehensive indicator. The combined visualization provides a layered market context that assists traders in making informed decisions quickly. The color-adaptive EMAs add clarity to trend direction, while the ORB and PDH/PDL levels highlight significant price zones for breakout or reversal trades.
How to Use:
Breakout Trades: Watch for price breaks above the ORB high or below the ORB low, especially when supported by EMA trends.
Trend Confirmation: Use the color-adaptive 12/48 EMA system to gauge momentum and market direction.
Reversal or Continuation: Observe how price reacts around PDH/PDL levels, especially if confluence with EMAs occurs.
This indicator is suitable for day traders seeking a clear and efficient way to track market structure, identify trends, and spot potential trade opportunities during regular market hours.
ملاحظات الأخبار
Overview:This indicator combines the 5-Minute Opening Range Breakout (ORB), Adaptive 12/48 Exponential Moving Averages (EMAs) along with an optional 9 and 200 ema, and Previous Day High/Low (PDH/PDL) levels to help traders identify key intraday levels and market trends.
Key Components and Logic:
5-Minute Opening Range Breakout (ORB):
- Displays the high and low from the first 5-minute candle of the trading session.
- Includes customizable opacity for the range fill.
- Helps traders spot breakout opportunities and key support/resistance zones.
Adaptive 12/48 EMA System:
- Displays EMAs for 9, 12, 48, and 200 periods.
- The 12 EMA changes color based on whether the price is entirely above or below it.
- The 48 EMA changes color depending on its relationship with the 12 EMA.
- Provides dynamic trend identification and potential entry/exit signals.
Previous Day High/Low (PDH/PDL):
- Displays the previous day’s high and low levels.
- Useful for tracking key intraday support/resistance levels and potential reversal points.
Summary:
This script stands out by blending three popular intraday tools into a single comprehensive indicator. The combined visualization provides a layered market context that assists traders in making informed decisions quickly through a back tested strategy. The color-adaptive EMAs add clarity to trend direction, while the ORB and PDH/PDL levels highlight significant price zones for breakout or reversal trades.
How to Use:
Breakout Trades: Watch for price breaks above the ORB high or below the ORB low, especially when supported by EMA trends.
Trend Confirmation: Use the color-adaptive 12/48 EMA system to gauge momentum and market direction.
Reversal or Continuation: Observe how price reacts around PDH/PDL levels, especially if confluence with EMAs occurs.
Note: Settings to keep a simple and aesthetic setup include an opacity of 87 for the ORB range, leaving the plots for the top and bottom of the ORB range OFF (leaving only the range), and keeping only the 12ema to keep a simple short-term trend identification. Adding the 9,48, and 200 may be used for a shorter or longer trend confluence on any timeframe. Settings are easily customizable, allowing traders to tailor the indicator for a clear and personalized visualization of their preferred setup.
This indicator is suitable for day traders seeking a clear and efficient way to track market structure, identify trends, and spot potential trade opportunities during regular market hours.
نص برمجي مفتوح المصدر
بروح TradingView الحقيقية، قام مبتكر هذا النص البرمجي بجعله مفتوح المصدر، بحيث يمكن للمتداولين مراجعة وظائفه والتحقق منها. شكرا للمؤلف! بينما يمكنك استخدامه مجانًا، تذكر أن إعادة نشر الكود يخضع لقواعد الموقع الخاصة بنا.
إخلاء المسؤولية
لا يُقصد بالمعلومات والمنشورات أن تكون، أو تشكل، أي نصيحة مالية أو استثمارية أو تجارية أو أنواع أخرى من النصائح أو التوصيات المقدمة أو المعتمدة من TradingView. اقرأ المزيد في شروط الاستخدام.