OPEN-SOURCE SCRIPT
تم تحديثه Global Money Supply USD-Adjusted
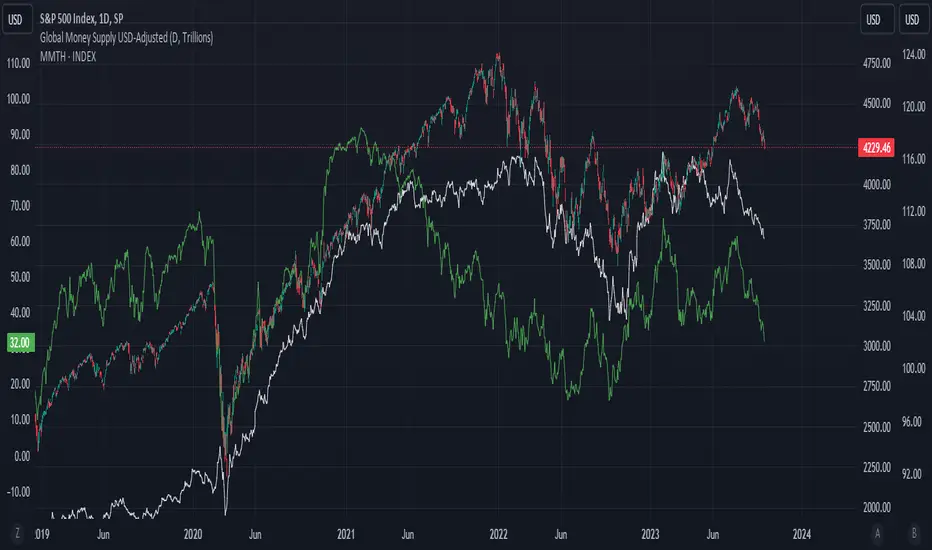
Global Money Supply Aggregates
- US, China, EU, Japan, UK
- Korea, India, Canada, HK, Australia
- Taiwan, Brazil, Swiss, Russia, Mexico
- Thailand, Indonesia, Saudi, Singapore, Vietnam
Unfortunately, TV Pine can only take in 40 tickers, Each country has Money Supply Data adjusted against its FX to USD.
The formula in TV only can contain 10 tickers. So would recommend doing it up yourself on the first big 5 countries,
Anyway US and China constitute close to 50% of the global money supply.
However, one can argue whether money supply data (broad money) is valid nowadays. But I would bring up that this is just for comparison and trend purposes. Yes, M3 was removed from the US Fed data releases in end-2005.
Aggregating all of the above tickers yield me around 120tn of money supply, USD-adjusted.
There's pretty much other countries that should be included but due to the lack of data and small size of the country, it is omitted.
Examples:
- Heavily Sanctioned: Iran (400-500bn) and Iraq (200-300bn)
- No Data/Bad Data: Algeria (100bn), Bangladesh (110bn)
- Fallen Angels: Venezuela (100bn?), Argentina (120bn)
- 400-500bn club: Israel, Turkey, Poland, Sweden, Ireland, UAE, Msia, Chile
- 200-300bn club: Norway, Czech, Philippines, S.Africa, New Zealand, Egypt, Denmark, Qatar
- 100bn club: Colombia, Lebanon, Pakistan, Morocco, Romania, Hungary, Nigeria, Kuwait
- GDP 1bn club: Peru, Kazakhstan, Angola, Sudan, Ukraine, Ecuador
All these could add up to 10-15tn money supply, but with currencies with bad adoption on some. End of the day, we still living in a dollarised world, with the big 5 nations taking up to 80% of the officially published money supply. The unfortunate issue is that the money supply data isn't that forward-looking. A simple linear extrapolation of historical 3-month rolling average for next month estimates can be decent, with possibility of manual meddling to add adjustments on huge macro-events eg QE infinity.
Perhaps, additional tweaking would be inflation-adjusting this. Against SPX, some housing index, crude oil, gold.
howmuch.net/articles/broad-money-world-2019
ملاحظات الأخبار
Global Money Supply Aggregates- US, China, EU, Japan, UK
- Korea, India, Canada Australia
- Taiwan, Brazil, Swiss, Russia, Mexico
- Thailand, Indonesia, Singapore
** Removed Saudi (currency is pegged, doesn't reflect capital flows well, unless TV starts publishing USDSAR 12M forwards)
** Removed Vietnam (currency is pegged and they publish their money supply data once a year)
** Removed Hong Kong (currency is pegged)
Unfortunately, TV Pine can only take in 40 tickers, Each country has Money Supply Data adjusted against its FX to USD. The formula in TV only can contain 10 tickers. So would recommend doing it up yourself on the first big 5 countries (or currency bloc eg EU). Anyway US and China constitute close to 50% of the global money supply. However, one can argue whether money supply data (broad money) is valid nowadays. But I would bring up that this is just for comparison and trend purposes. Yes, M3 was removed from the US Fed data releases in end-2005. Aggregating all of the above tickers yield me around 120tn of money supply, USD-adjusted.
There's pretty much other countries that should be included but due to the lack of data and small size of the country, it is omitted.
Examples:
- Heavily Sanctioned: Iran (400-500bn) and Iraq (200-300bn)
- No Data/Bad Data: Algeria (100bn), Bangladesh (110bn)
- Fallen Angels: Venezuela (100bn?), Argentina (120bn)
- 400-500bn club: Israel, Turkey, Poland, Sweden, Ireland, UAE, Msia, Chile
- 200-300bn club: Norway, Czech, Philippines, S.Africa, New Zealand, Egypt, Denmark, Qatar
- 100bn club: Colombia, Lebanon, Pakistan, Morocco, Romania, Hungary, Nigeria, Kuwait
- GDP 100bn club: Peru, Kazakhstan, Angola, Sudan, Ukraine, Ecuador
All these could add up to 10-15tn money supply, but with currencies with bad adoption on some. End of the day, we still living in a dollarized world, with the big 20-30 nations taking up to 80% of the officially published money supply. The unfortunate issue is that the money supply data isn't that forward-looking. A simple linear extrapolation of historical 3-month rolling average for next month estimates can be decent, with possibility of manual meddling to add adjustments on huge macro-events eg QE infinity. Also, the official money supply only gets updated at the start of the month, so you would see great increases in money supply data. So it would be important to keep tabs on macro policies especially debt issuance, QE / open market operations, repos and liquidity injections.
Perhaps, additional tweaking would be inflation-adjusting this. Against SPX, some housing index, crude oil, gold.
howmuch.net/articles...oad-money-world-2019
ملاحظات الأخبار
Global Money Supply Aggregates- US, China, EU, Japan, UK
- Korea, India, Canada Australia
- Taiwan, Brazil, Swiss, Russia, Mexico
- Thailand, Indonesia, Singapore
** Removed Saudi (currency is pegged, doesn't reflect capital flows well, unless TV starts publishing USDSAR 12M forwards)
** Removed Vietnam (currency is pegged and they publish their money supply data once a year)
** Removed Hong Kong (currency is pegged)
Unfortunately, TV Pine can only take in 40 tickers, Each country has Money Supply Data adjusted against its FX to USD. The formula in TV only can contain 10 tickers. So would recommend doing it up yourself on the first big 5 countries (or currency bloc eg EU). Anyway US and China constitute close to 50% of the global money supply. However, one can argue whether money supply data (broad money) is valid nowadays. But I would bring up that this is just for comparison and trend purposes. Yes, M3 was removed from the US Fed data releases in end-2005. Aggregating all of the above tickers yield me around 120tn of money supply, USD-adjusted.
There's pretty much other countries that should be included but due to the lack of data and small size of the country, it is omitted.
Examples:
- Heavily Sanctioned: Iran (400-500bn) and Iraq (200-300bn)
- No Data/Bad Data: Algeria (100bn), Bangladesh (110bn)
- Fallen Angels: Venezuela (100bn?), Argentina (120bn)
- 400-500bn club: Israel, Turkey, Poland, Sweden, Ireland, UAE, Msia, Chile
- 200-300bn club: Norway, Czech, Philippines, S.Africa, New Zealand, Egypt, Denmark, Qatar
- 100bn club: Colombia, Lebanon, Pakistan, Morocco, Romania, Hungary, Nigeria, Kuwait
- GDP 100bn club: Peru, Kazakhstan, Angola, Sudan, Ukraine, Ecuador
All these could add up to 10-15tn money supply, but with currencies with bad adoption on some. End of the day, we still living in a dollarized world, with the big 20-30 nations taking up to 80% of the officially published money supply. The unfortunate issue is that the money supply data isn't that forward-looking. A simple linear extrapolation of historical 3-month rolling average for next month estimates can be decent, with possibility of manual meddling to add adjustments on huge macro-events eg QE infinity. Also, the official money supply only gets updated at the start of the month, so you would see great increases in money supply data. So it would be important to keep tabs on macro policies especially debt issuance, QE / open market operations, repos and liquidity injections.
Perhaps, additional tweaking would be inflation-adjusting this. Against SPX, some housing index, crude oil, gold.
howmuch.net/articles/broad-money-world-2019
ملاحظات الأخبار
Changed reference from FRED: M2SL to FED: WM2NS , it updates weekly , for US Money Supply. Just went through my notes again - the money supply doesn't actually covers all foreign assets held by the private sector. So I might need to relook at other indicators eg Commercial Banks Balance Sheet, Banking Sector Total Assets etc. نص برمجي مفتوح المصدر
بروح TradingView الحقيقية، قام مبتكر هذا النص البرمجي بجعله مفتوح المصدر، بحيث يمكن للمتداولين مراجعة وظائفه والتحقق منها. شكرا للمؤلف! بينما يمكنك استخدامه مجانًا، تذكر أن إعادة نشر الكود يخضع لقواعد الموقع الخاصة بنا.
إخلاء المسؤولية
لا يُقصد بالمعلومات والمنشورات أن تكون، أو تشكل، أي نصيحة مالية أو استثمارية أو تجارية أو أنواع أخرى من النصائح أو التوصيات المقدمة أو المعتمدة من TradingView. اقرأ المزيد في شروط الاستخدام.
نص برمجي مفتوح المصدر
بروح TradingView الحقيقية، قام مبتكر هذا النص البرمجي بجعله مفتوح المصدر، بحيث يمكن للمتداولين مراجعة وظائفه والتحقق منها. شكرا للمؤلف! بينما يمكنك استخدامه مجانًا، تذكر أن إعادة نشر الكود يخضع لقواعد الموقع الخاصة بنا.
إخلاء المسؤولية
لا يُقصد بالمعلومات والمنشورات أن تكون، أو تشكل، أي نصيحة مالية أو استثمارية أو تجارية أو أنواع أخرى من النصائح أو التوصيات المقدمة أو المعتمدة من TradingView. اقرأ المزيد في شروط الاستخدام.