OPEN-SOURCE SCRIPT
EMA 20/50/100/200 Daily-Weekly
Hello!
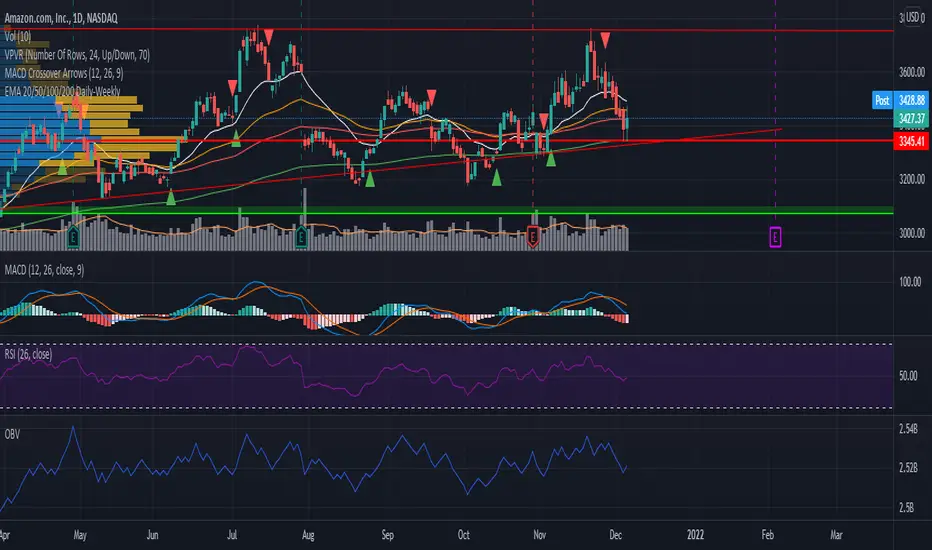
In case this helps others when using EMA's on multiple timeframes, I decided to publish this script I modified.
It adds the EMA for 20/50/100/200 timeframes and gives them the color white, orange, red, green respectively.
The weekly timeframe will get the corresponding weekly EMA.
The monthly timeframe will get the corresponding monthly EMA.
The daily timeframe, and all timeframes below this, will get the daily timeframe. The idea that that a ticker symbol might respect with strength the daily EMA's - you'll be able to move to a smaller timeframe and still view the daily EMA's in an effort to better view how close the ticker came to taking a specific EMA.
نص برمجي مفتوح المصدر
بروح TradingView الحقيقية، قام مبتكر هذا النص البرمجي بجعله مفتوح المصدر، بحيث يمكن للمتداولين مراجعة وظائفه والتحقق منها. شكرا للمؤلف! بينما يمكنك استخدامه مجانًا، تذكر أن إعادة نشر الكود يخضع لقواعد الموقع الخاصة بنا.
إخلاء المسؤولية
لا يُقصد بالمعلومات والمنشورات أن تكون، أو تشكل، أي نصيحة مالية أو استثمارية أو تجارية أو أنواع أخرى من النصائح أو التوصيات المقدمة أو المعتمدة من TradingView. اقرأ المزيد في شروط الاستخدام.