OPEN-SOURCE SCRIPT
CM_ADX+DMI Mod
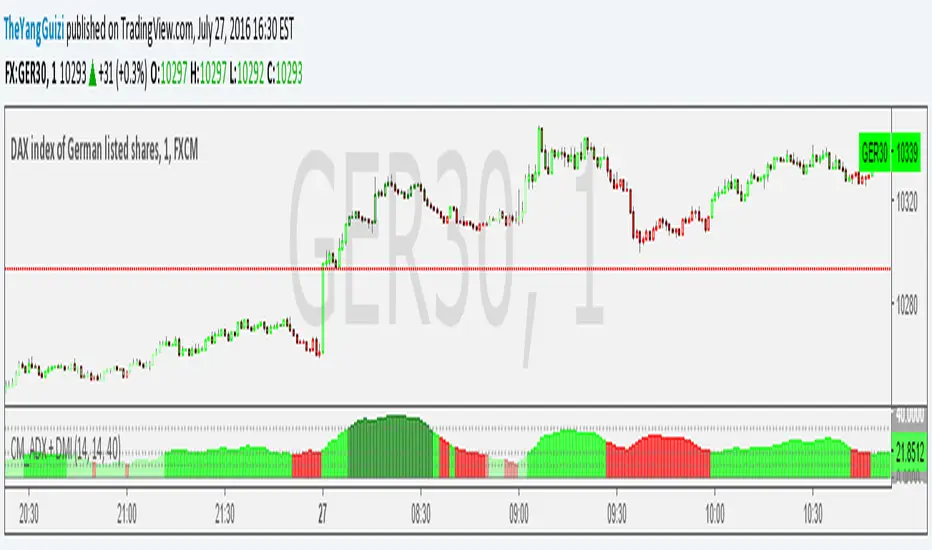
Mashed together Chris Moody's ADX thing with his DMI thing.
So you can see trend strength + direction
green-ish = uptrend-ish//red-ish = downtrend-ish
Colors can be adjusted though.
below 10 = gray, not much going on
10 - 20 = light green/light red, could be the beginning o something
20 - 40 = bright green / bright red, something is going on
above 40 = dark green, dark red, exhaustion (default is 40, can be adjusted to whatever)
نص برمجي مفتوح المصدر
بروح TradingView الحقيقية، قام مبتكر هذا النص البرمجي بجعله مفتوح المصدر، بحيث يمكن للمتداولين مراجعة وظائفه والتحقق منها. شكرا للمؤلف! بينما يمكنك استخدامه مجانًا، تذكر أن إعادة نشر الكود يخضع لقواعد الموقع الخاصة بنا.
إخلاء المسؤولية
لا يُقصد بالمعلومات والمنشورات أن تكون، أو تشكل، أي نصيحة مالية أو استثمارية أو تجارية أو أنواع أخرى من النصائح أو التوصيات المقدمة أو المعتمدة من TradingView. اقرأ المزيد في شروط الاستخدام.