OPEN-SOURCE SCRIPT
First 9:15-9:20 Candle Levels (Daily)
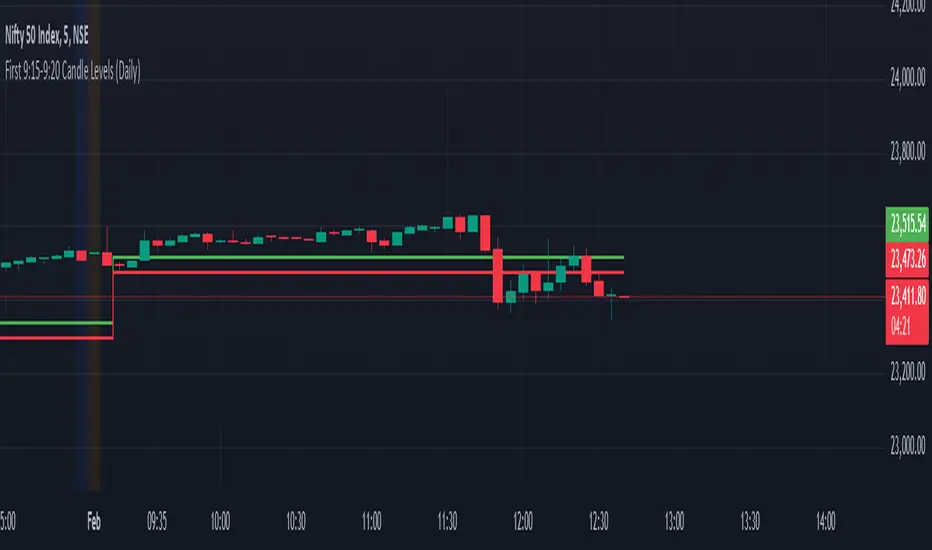
This indicator captures the closing price of the first 5-minute candle (9:15 - 9:20 AM) every trading day. It then calculates 0.09% above and below this closing price and plots horizontal lines. The indicator resets daily at 9:15 AM, ensuring it always tracks the latest market open. After 9:20 AM, the calculated levels remain visible throughout the day. The upper level is displayed in green, while the lower level is in red. This tool helps traders identify key price levels early in the session, useful for setting stop-losses, take-profit zones, or identifying potential breakout points.
نص برمجي مفتوح المصدر
بروح TradingView الحقيقية، قام مبتكر هذا النص البرمجي بجعله مفتوح المصدر، بحيث يمكن للمتداولين مراجعة وظائفه والتحقق منها. شكرا للمؤلف! بينما يمكنك استخدامه مجانًا، تذكر أن إعادة نشر الكود يخضع لقواعد الموقع الخاصة بنا.
إخلاء المسؤولية
لا يُقصد بالمعلومات والمنشورات أن تكون، أو تشكل، أي نصيحة مالية أو استثمارية أو تجارية أو أنواع أخرى من النصائح أو التوصيات المقدمة أو المعتمدة من TradingView. اقرأ المزيد في شروط الاستخدام.