OPEN-SOURCE SCRIPT
Automatic Fibonacci Levels with EMA

Automatic Fibonacci Levels with EMA
Description:
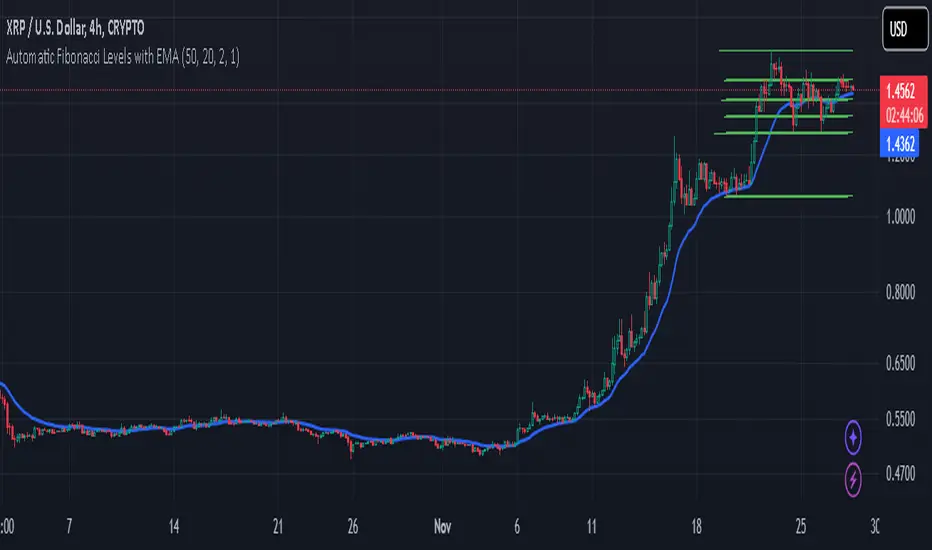
This script automatically calculates and displays Fibonacci retracement levels based on the highest and lowest prices over a dynamic lookback period. The Fibonacci levels are recalculated on every bar to adapt to price changes, providing an ongoing analysis of key support and resistance areas.
The Fibonacci levels are dynamically colored to reflect the trend direction, determined by the position of the price relative to the Exponential Moving Average (EMA). When the market is in an uptrend (price above EMA), Fibonacci levels are displayed in green, and in a downtrend (price below EMA), they are shown in red. This color coding helps traders quickly identify the current market direction.
Key Features:
Dynamic Fibonacci Levels: Automatically adjusts Fibonacci retracement levels based on recent price action, recalculated with each new bar.
EMA Trend Confirmation: The trend is confirmed by the position of the price relative to the 20-period EMA. Fibonacci levels are color-coded to reflect this trend.
Customizable Lookback Period: Adjust the base lookback period (default 50) and scale it according to your preferred timeframe for more or less sensitivity to recent price action.
Flexible Fibonacci Duration: The Fibonacci levels remain on the chart for a customizable duration (default 2 bars), allowing for visual clarity while adapting to new price action.
Timeframe Scaling: The script automatically adjusts the lookback period based on a scaling factor, making it suitable for different timeframes.
How to Use:
Use the Fibonacci levels to identify potential support and resistance zones based on the market's current price range.
Combine the trend color coding with your own strategy to enhance decision-making, whether for long or short entries.
Adjust the Lookback Period and Fibonacci Duration based on your trading style and timeframe preferences.
This script provides an automatic and customizable way to visualize Fibonacci retracements in a dynamic manner, helping traders make informed decisions based on trend direction and key price levels.
Note: As with any trading tool, always use proper risk management and test the script before using it in live trading.
نص برمجي مفتوح المصدر
بروح TradingView الحقيقية، قام مبتكر هذا النص البرمجي بجعله مفتوح المصدر، بحيث يمكن للمتداولين مراجعة وظائفه والتحقق منها. شكرا للمؤلف! بينما يمكنك استخدامه مجانًا، تذكر أن إعادة نشر الكود يخضع لقواعد الموقع الخاصة بنا.
إخلاء المسؤولية
لا يُقصد بالمعلومات والمنشورات أن تكون، أو تشكل، أي نصيحة مالية أو استثمارية أو تجارية أو أنواع أخرى من النصائح أو التوصيات المقدمة أو المعتمدة من TradingView. اقرأ المزيد في شروط الاستخدام.