OPEN-SOURCE SCRIPT
Ultimate Gold Correlation Matrix (Extended)
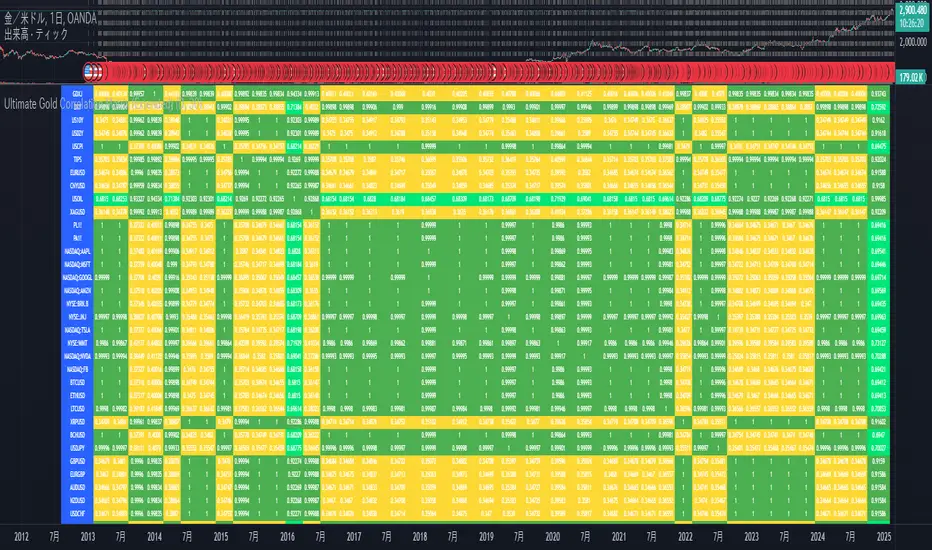
This is a correlation matrix to help you visually understand the relationship between stocks. This is the correlation of the amount of change.
The color changes depending on the value of the correlation value.
By making a node diagram of this relationship, what has been difficult to understand may become clearer.
Good luck.
1. meaning of correlation coefficient
Correlation Coefficient ranges from -1 to +1.
Correlation Coefficient Value Interpretation
+1.00 Perfect positive correlation (when one goes up, the other always goes up)
+0.75 ~ +0.99 Strong positive correlation (fairly well linked)
+0.50 ~ +0.74 Moderate positive correlation
+0.30 ~ +0.49 Weak positive correlation
-0.30 ~ +0.30 No correlation (no or weak relationship)
-0.50 ~ -0.74 Moderate negative correlation
-0.75 ~ -0.99 Strong negative correlation (when one goes up, the other goes down)
-1.00 Perfect negative correlation (opposite moves)
Translated with DeepL.com/Translator (free version)
نص برمجي مفتوح المصدر
بروح TradingView الحقيقية، قام مبتكر هذا النص البرمجي بجعله مفتوح المصدر، بحيث يمكن للمتداولين مراجعة وظائفه والتحقق منها. شكرا للمؤلف! بينما يمكنك استخدامه مجانًا، تذكر أن إعادة نشر الكود يخضع لقواعد الموقع الخاصة بنا.
إخلاء المسؤولية
لا يُقصد بالمعلومات والمنشورات أن تكون، أو تشكل، أي نصيحة مالية أو استثمارية أو تجارية أو أنواع أخرى من النصائح أو التوصيات المقدمة أو المعتمدة من TradingView. اقرأ المزيد في شروط الاستخدام.