OPEN-SOURCE SCRIPT
Table: EMA Surveillance
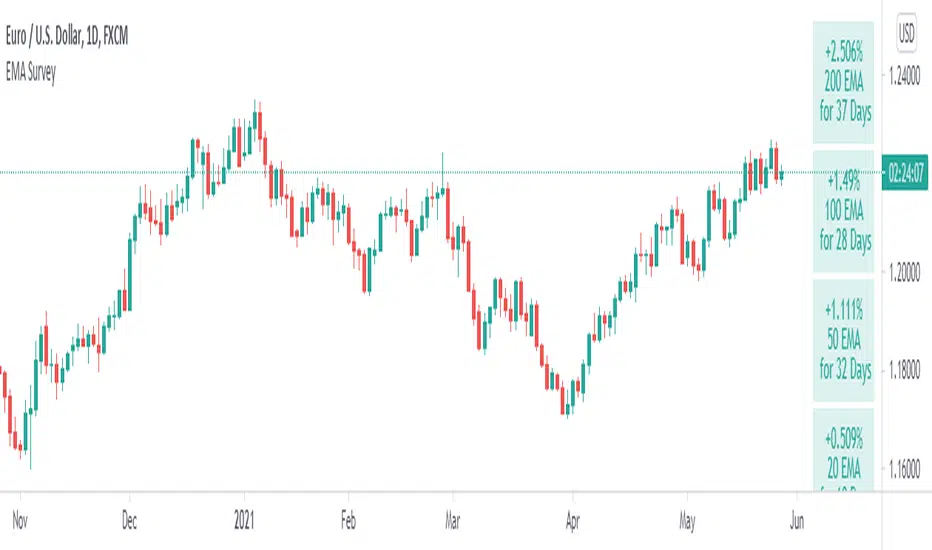
This script will show information of interest about Moving Averages from the selected timeframe.
The idea is to provide data from higher timeframes (Daily preferably).
The information provided includes:
• selected length and calculation
• a relative position of the close to the average (above, below, and how much)
• how many periods passed since the moving average has been tested - any break counts as a test, it doesn't have to close on the opposite side

Global Settings:
• Timeframe of the moving averages
• Choose to see simple words such as "Above" / "Below" OR the specific percentage OR how much percentage % it moved from the moving average?
• EMA or SMA
Moving Average Settings:
• Up to 6 different lengths
• You can deactivate the averages you don't need
I hope it will be useful. Good luck!
The idea is to provide data from higher timeframes (Daily preferably).
The information provided includes:
• selected length and calculation
• a relative position of the close to the average (above, below, and how much)
• how many periods passed since the moving average has been tested - any break counts as a test, it doesn't have to close on the opposite side
Global Settings:
• Timeframe of the moving averages
• Choose to see simple words such as "Above" / "Below" OR the specific percentage OR how much percentage % it moved from the moving average?
• EMA or SMA
Moving Average Settings:
• Up to 6 different lengths
• You can deactivate the averages you don't need
I hope it will be useful. Good luck!
نص برمجي مفتوح المصدر
بروح TradingView الحقيقية، قام مبتكر هذا النص البرمجي بجعله مفتوح المصدر، بحيث يمكن للمتداولين مراجعة وظائفه والتحقق منها. شكرا للمؤلف! بينما يمكنك استخدامه مجانًا، تذكر أن إعادة نشر الكود يخضع لقواعد الموقع الخاصة بنا.
إخلاء المسؤولية
لا يُقصد بالمعلومات والمنشورات أن تكون، أو تشكل، أي نصيحة مالية أو استثمارية أو تجارية أو أنواع أخرى من النصائح أو التوصيات المقدمة أو المعتمدة من TradingView. اقرأ المزيد في شروط الاستخدام.