OPEN-SOURCE SCRIPT
Support Resistance - CryptoPredix

How this indicator works :
1. Setup and Inputs: The script sets up user inputs for various parameters such as pivot period (prd), pivot source (ppsrc), maximum channel width (ChannelW), maximum number of support/resistance levels (maxnumsr), minimum strength (min_strength), label location (labelloc), line style (linestyle), and line width (linewidth).Colors for support and resistance lines are also defined (supportcolor, resistancecolor).
2. Pivot Point Calculation: The script calculates pivot high and pivot low values based on the selected source (either High/Low or Close/Open).It uses the ta.pivothigh and ta.pivotlow functions to identify these pivot points over the specified period (prd).
3. Plotting Pivot Points: If the showpp option is enabled, the script plots pivot high and pivot low points on the chart using plotshape.
4. Managing Pivot Values: The script maintains an array (pivotvals) to store recent pivot values, ensuring the number of stored values does not exceed the maximum specified (maxnumpp).
5. Support and Resistance Zone Calculation: It calculates support and resistance zones by finding ranges of pivot values that fall within a specified channel width (cwidth).The function get_sr_vals returns the highest, lowest values, and the number of pivot points within the channel width.
6. Storing Support and Resistance Levels: The script manages arrays for support and resistance levels (sr_up_level, sr_dn_level) and their strength (sr_strength).It uses the check_sr function to ensure that new support/resistance levels are valid and don't overlap with existing ones unless they have higher strength.
7. Label and Line Management: The script dynamically updates labels and lines for the support and resistance levels, adjusting their positions, colors, and styles based on the latest data.It ensures the labels and lines are in sync with the current bar index and close price.
8. Identifying Crossings: Functions f_crossed_over and f_crossed_under check if the close price has crossed above or below the identified support or resistance levels.These functions iterate through the support/resistance arrays and check the conditions for crossing.
9. Alerts: The script sets up alert conditions to notify when the price crosses above a resistance level or below a support level.Alerts are configured with titles and messages ('Resistance Broken' and 'Support Broken').
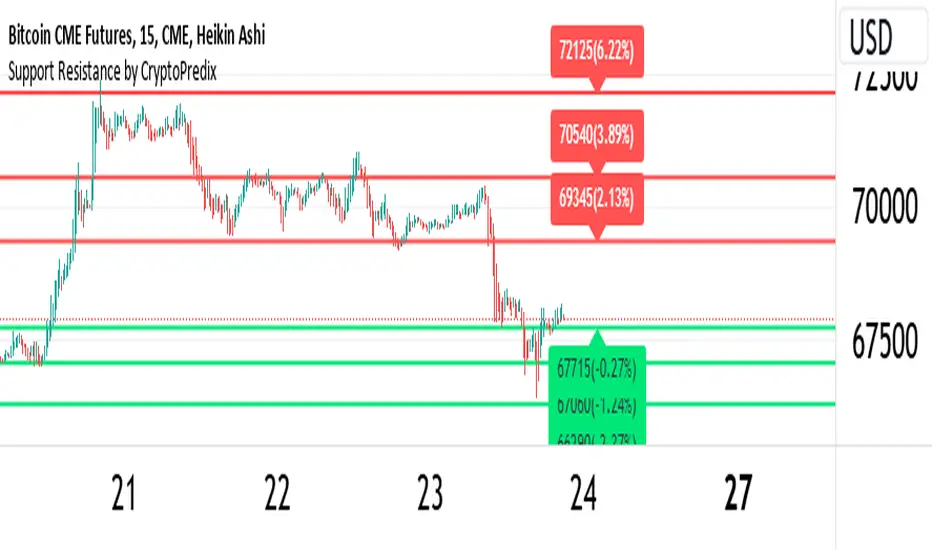
10. Visualization: The script provides visual cues on the chart by plotting support and resistance lines with different styles and colors.It also dynamically updates labels to display the level values and their percentage distance from the current close price.
This script helps traders identify key support and resistance levels on a chart, providing both visual cues and alerts for significant price movements relative to these levels.
نص برمجي مفتوح المصدر
بروح TradingView الحقيقية، قام مبتكر هذا النص البرمجي بجعله مفتوح المصدر، بحيث يمكن للمتداولين مراجعة وظائفه والتحقق منها. شكرا للمؤلف! بينما يمكنك استخدامه مجانًا، تذكر أن إعادة نشر الكود يخضع لقواعد الموقع الخاصة بنا.
إخلاء المسؤولية
لا يُقصد بالمعلومات والمنشورات أن تكون، أو تشكل، أي نصيحة مالية أو استثمارية أو تجارية أو أنواع أخرى من النصائح أو التوصيات المقدمة أو المعتمدة من TradingView. اقرأ المزيد في شروط الاستخدام.