PROTECTED SOURCE SCRIPT
Trendy ADX DI+ DI- Trend Strength - Bonavest

To add this indicator to your charts:
Click the 'Add to Favorite Scripts' button down below this description.
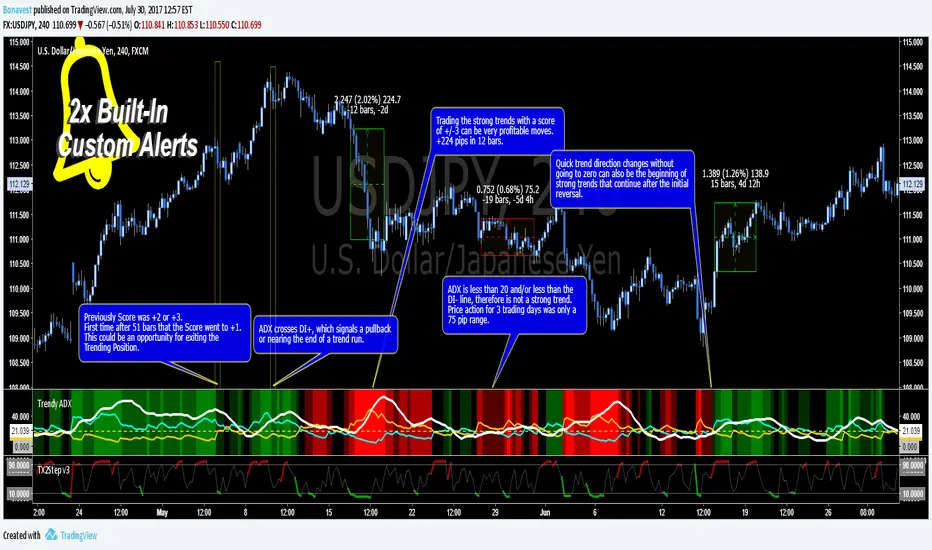
Trendy ADX is a lower indicator that is used to determine strength of trends. The DI+ and DI- lines cross one another depending on the trend direction based on the Length input with the current trend, DI line, being on top or higher.
The ADX line shows the strength of the current trend, with a value over 20 being a trend with growing strength. Trends with ADX less than 20 are said to not be strong enough to be traded as well as if the ADX is less than both the DI+ and DI- even though it is higher than 20.
An added number value that is not a part of the typical ADX/DI indicator is the 'Score'. This is a value that ranges from -3 to +3 including 0. This score allows you to set alerts based on Score and be alerted when a certain level is reached. The Score values are fully configureable in the Input Settings screen.
The Length setting is the only important adjustment for the indicator itself. The 3 suggested values to use are 7, 11 and 20 (default 11).
The Threshold setting is purely for visual adjustment of the yellow dashed line (default 20).
I use this indicator for:
My observations in using this indicator is to ignore reversal signals if the ADX line has not crossed above the DI+ or DI- line of the current trend (red/green background). I also expect a small pullback or sideways price action when the ADX line does cross the current trending DI line.
There are 2 Built-In Notifications already created for you and are available by simply right clicking in the indicator area and selecting:
Condition: Trendy ADX
Then 1 of the 2 Alerts:
Trend Direction Change - Score crosses 0 changing to 1 (green/UP) or -1 (red/DOWN)
Trend Strength Change - Score changes in any direction by a value of 1
How to Trade the Average Directinal Index Video: youtu.be/Csq7gDnbapI?t=31s
This adaptation was based off of the original code from @MasaNakamura.
tradingview.com/v/VTPMMOrx/
Click the 'Add to Favorite Scripts' button down below this description.
Trendy ADX is a lower indicator that is used to determine strength of trends. The DI+ and DI- lines cross one another depending on the trend direction based on the Length input with the current trend, DI line, being on top or higher.
The ADX line shows the strength of the current trend, with a value over 20 being a trend with growing strength. Trends with ADX less than 20 are said to not be strong enough to be traded as well as if the ADX is less than both the DI+ and DI- even though it is higher than 20.
An added number value that is not a part of the typical ADX/DI indicator is the 'Score'. This is a value that ranges from -3 to +3 including 0. This score allows you to set alerts based on Score and be alerted when a certain level is reached. The Score values are fully configureable in the Input Settings screen.
The Length setting is the only important adjustment for the indicator itself. The 3 suggested values to use are 7, 11 and 20 (default 11).
The Threshold setting is purely for visual adjustment of the yellow dashed line (default 20).
I use this indicator for:
- Keeps me in a trade longer to capture long trends
- Determining if the current trend has more room to continue
- Filter out reversal buy/sell signals if trend is just beginning
My observations in using this indicator is to ignore reversal signals if the ADX line has not crossed above the DI+ or DI- line of the current trend (red/green background). I also expect a small pullback or sideways price action when the ADX line does cross the current trending DI line.
There are 2 Built-In Notifications already created for you and are available by simply right clicking in the indicator area and selecting:
Condition: Trendy ADX
Then 1 of the 2 Alerts:
Trend Direction Change - Score crosses 0 changing to 1 (green/UP) or -1 (red/DOWN)
Trend Strength Change - Score changes in any direction by a value of 1
How to Trade the Average Directinal Index Video: youtu.be/Csq7gDnbapI?t=31s
This adaptation was based off of the original code from @MasaNakamura.
tradingview.com/v/VTPMMOrx/
نص برمجي محمي
تم نشر هذا النص البرمجي كمصدر مغلق. ومع ذلك، يمكنك استخدامه بحرية ودون أي قيود - تعرف على المزيد هنا.
إخلاء المسؤولية
لا يُقصد بالمعلومات والمنشورات أن تكون، أو تشكل، أي نصيحة مالية أو استثمارية أو تجارية أو أنواع أخرى من النصائح أو التوصيات المقدمة أو المعتمدة من TradingView. اقرأ المزيد في شروط الاستخدام.