OPEN-SOURCE SCRIPT
تم تحديثه USD Market Liquidity [tedtalksmacro]
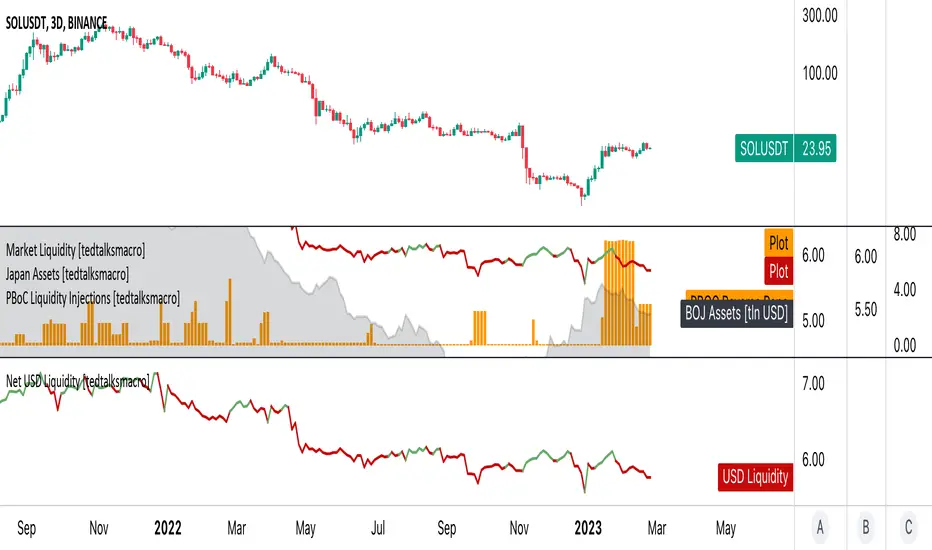
This script aggregates and analyses total USD market liquidity in trillions of dollars - albeit with lagged, weekly data (live data is not available in TradingView!)
There's a positive correlation with the total liquidity available in the world's largest economy and risk assets like BTCUSD
The formula for net liquidity is as follows and uses account balances at the Fed and of the Treasury's General Account:
Fed Balance Sheet USBBS — Accepted Reverse Repo Bids RRPONTTLD — Treasury General Account Balance WTREGEN
This script shows positive prints when liquidity is above it's 7 day EMA and negative when below... don't use this on timeframes lower than the 1D chart!
There's a positive correlation with the total liquidity available in the world's largest economy and risk assets like
The formula for net liquidity is as follows and uses account balances at the Fed and of the Treasury's General Account:
Fed Balance Sheet
This script shows positive prints when liquidity is above it's 7 day EMA and negative when below... don't use this on timeframes lower than the 1D chart!
ملاحظات الأخبار
Overlay changed to false.ملاحظات الأخبار
name updatedملاحظات الأخبار
plot titles updatedنص برمجي مفتوح المصدر
بروح TradingView الحقيقية، قام مبتكر هذا النص البرمجي بجعله مفتوح المصدر، بحيث يمكن للمتداولين مراجعة وظائفه والتحقق منها. شكرا للمؤلف! بينما يمكنك استخدامه مجانًا، تذكر أن إعادة نشر الكود يخضع لقواعد الموقع الخاصة بنا.
إخلاء المسؤولية
لا يُقصد بالمعلومات والمنشورات أن تكون، أو تشكل، أي نصيحة مالية أو استثمارية أو تجارية أو أنواع أخرى من النصائح أو التوصيات المقدمة أو المعتمدة من TradingView. اقرأ المزيد في شروط الاستخدام.
نص برمجي مفتوح المصدر
بروح TradingView الحقيقية، قام مبتكر هذا النص البرمجي بجعله مفتوح المصدر، بحيث يمكن للمتداولين مراجعة وظائفه والتحقق منها. شكرا للمؤلف! بينما يمكنك استخدامه مجانًا، تذكر أن إعادة نشر الكود يخضع لقواعد الموقع الخاصة بنا.
إخلاء المسؤولية
لا يُقصد بالمعلومات والمنشورات أن تكون، أو تشكل، أي نصيحة مالية أو استثمارية أو تجارية أو أنواع أخرى من النصائح أو التوصيات المقدمة أو المعتمدة من TradingView. اقرأ المزيد في شروط الاستخدام.