OPEN-SOURCE SCRIPT
تم تحديثه [dharmatech] U.S. Treasury Yield Curve

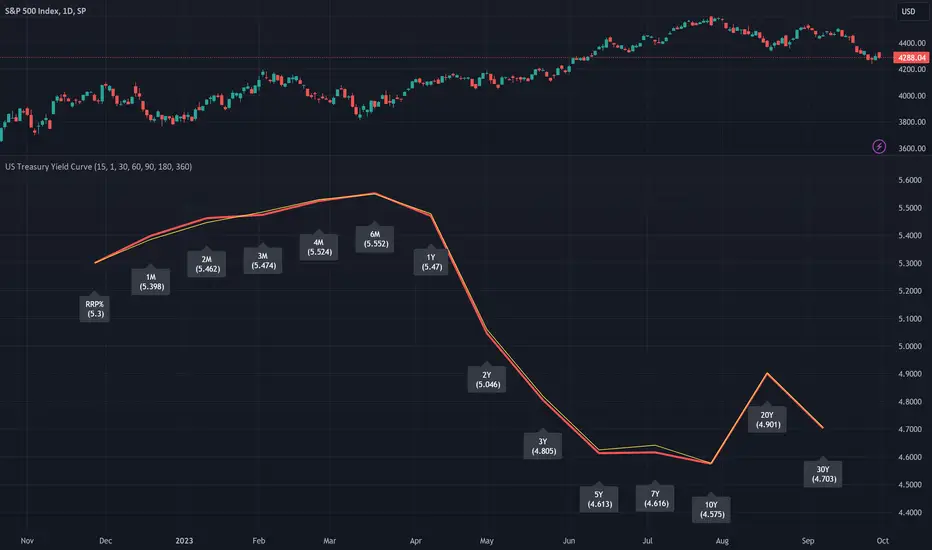
This indicator displays the U.S. Treasury Securities Yield Curve.
This is a fork of the US Treasury Yield Curve indicator by @longflat. Thank you for sharing your work!
There are already so many yield curve indicators on TradingView.
What makes this one different?
Update to version 5 of Pine Script
Add RRP%
Add 4 month
Add 20 year
Show previous day's yield curve
Options for prior yield curves
The thick red line shows the latest yield curve.
The yellow line shows the yield curve 1 bar ago.
So, if your timeframe is set to 1 day, the yellow line will show yesterday's yield curve.
ملاحظات الأخبار
Hardcoded timeframe of securities to 1D.Without this, RRP doesn't load at lower timeframes.
Also, without this, at lower timeframes, the yield curve difference is sometimes hardly noticeable.
نص برمجي مفتوح المصدر
بروح TradingView الحقيقية، قام مبتكر هذا النص البرمجي بجعله مفتوح المصدر، بحيث يمكن للمتداولين مراجعة وظائفه والتحقق منها. شكرا للمؤلف! بينما يمكنك استخدامه مجانًا، تذكر أن إعادة نشر الكود يخضع لقواعد الموقع الخاصة بنا.
إخلاء المسؤولية
لا يُقصد بالمعلومات والمنشورات أن تكون، أو تشكل، أي نصيحة مالية أو استثمارية أو تجارية أو أنواع أخرى من النصائح أو التوصيات المقدمة أو المعتمدة من TradingView. اقرأ المزيد في شروط الاستخدام.