OPEN-SOURCE SCRIPT
Bar Replay
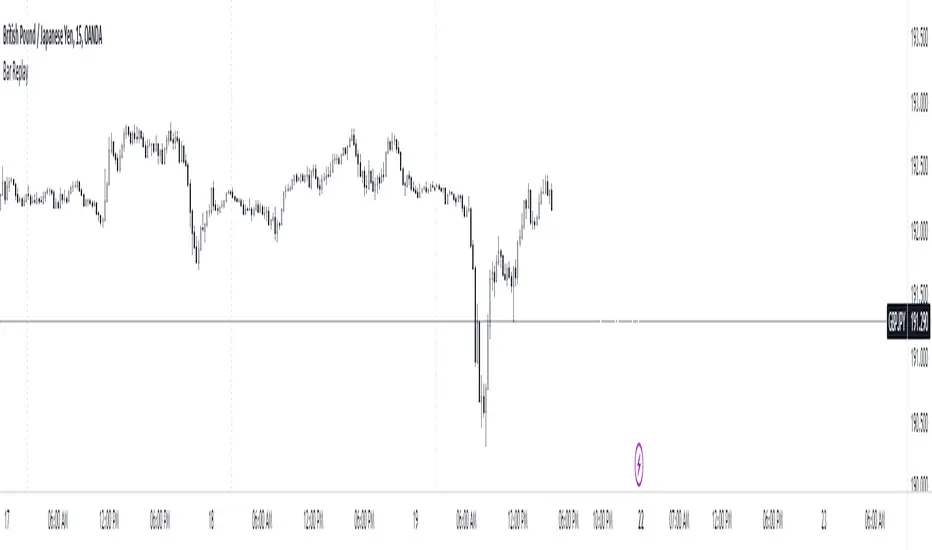
This indicator mirrors TradingView's bar replay feature to a certain extent, offering traders a streamlined way to analyze past market movements. It's a practical tool for strategy testing, pattern recognition, and refining trading approaches.
While it may have some limitations, it offers a practical solution for strategy testing and refining trading approaches for free and gets the job done. After all, having a tool is better than having none.
This is just an experiment so don't take it that seriously. I hope you guys find it useful.
If you have some ideas for improvement or found any bugs, kindly let me know.
How to use it?
Step 1 : Add the indicator to the chart.

Step 2 : Select the candle .
Step 3 : Make the changes visible.

Step 4 : How to Navigate

Step 5 : Change the date easily

The blank screen issue.

Note : There are some limitations
While it may have some limitations, it offers a practical solution for strategy testing and refining trading approaches for free and gets the job done. After all, having a tool is better than having none.
This is just an experiment so don't take it that seriously. I hope you guys find it useful.
If you have some ideas for improvement or found any bugs, kindly let me know.
How to use it?
Step 1 : Add the indicator to the chart.
Step 2 : Select the candle .
Step 3 : Make the changes visible.
Step 4 : How to Navigate
Step 5 : Change the date easily
The blank screen issue.
Note : There are some limitations
- The data is limited to the free plan.
- It's not smooth as the real Bar replay feature.
- I haven't checked the bugs so let me know if you found any.
نص برمجي مفتوح المصدر
بروح TradingView الحقيقية، قام مبتكر هذا النص البرمجي بجعله مفتوح المصدر، بحيث يمكن للمتداولين مراجعة وظائفه والتحقق منها. شكرا للمؤلف! بينما يمكنك استخدامه مجانًا، تذكر أن إعادة نشر الكود يخضع لقواعد الموقع الخاصة بنا.
إخلاء المسؤولية
لا يُقصد بالمعلومات والمنشورات أن تكون، أو تشكل، أي نصيحة مالية أو استثمارية أو تجارية أو أنواع أخرى من النصائح أو التوصيات المقدمة أو المعتمدة من TradingView. اقرأ المزيد في شروط الاستخدام.