X.Y Format Candle Volume & CompressionThe Volume & Compression Indicator is designed to help traders identify significant market moves by displaying two key metrics above each candle. The top number represents the Volume Ratio, which compares the current candle's volume to the average volume of recent candles. For example, a reading of 2.5 means the current volume is 2.5 times higher than average. When volume exceeds 9.9 times the average, the indicator displays an up or down arrow instead of a number, indicating extremely high volume in that direction.
The bottom number shows the Compression Ratio, which measures the relationship between volume and price movement. This helps identify when large amounts of volume are moving price significantly (low compression) versus when high volume isn't resulting in much price movement (high compression). High compression often indicates accumulation or distribution phases, while low compression with high volume typically suggests strong directional moves.
The indicator includes visual cues to help spot patterns. Dots appear above candles when both high volume and high compression persist over several candles, potentially indicating accumulation phases. Arrows mark possible pivot points after these accumulation periods. Additionally, the candles themselves can display a gradient color that intensifies with increased compression, making it easier to spot areas of interest.
For trading purposes, watch for volume spikes (top number above 2.0) as they can signal potential reversal points or confirm breakouts. High compression readings might precede breakouts, while low compression with high volume often confirms strong trend moves. The most significant signals often come when both metrics show high readings over multiple candles, suggesting sustained institutional interest.
خط تجميع/توزيع
BuySell%_ImtiazH_v2BuySell%_ImtiazH
This indicator includes two powerful volume metrics to complement your trading analysis:
30-Day Avg Vol (Blue Line): Tracks the average volume over the past 30 days, providing a baseline for typical trading activity.
Breakout Vol (White Line): Highlights the volume threshold needed for a potential breakout, calculated as a user-defined percentage above the 30-day average volume (default: 40%).
In addition to these enhancements, the indicator breaks down total trading volume into buying and selling components and calculates the percentage of buy volume for each bar.
🟥 Red Bars: Represent total volume.
🟩 Teal Bars: Show the buying volume within each candle.
🟨 Buy %: Displays the percentage of buy volume dynamically in the indicator panel, highlighted in yellow for quick visibility.
Use this tool to easily spot accumulation (buying pressure) or distribution (selling pressure) trends, customize breakout thresholds, and identify key breakout opportunities. Simple, clear, and effective for volume-based analysis!
How Are Buy Volume and Sell Volume Calculated?
This indicator uses a proportional approach to estimate buy and sell volumes based on price action:
Buy Volume: The portion of total volume where the price is moving upward, representing trades executed at the ask price.
Formula:
Buy Volume = (close - low) / (high - low) * volume
Sell Volume: The portion of total volume where the price is moving downward, representing trades executed at the bid price.
Formula:
Sell Volume = (high - close) / (high - low) * volume
If the high and low prices are the same (flat bar), both buy and sell volumes are set to 0.
Why This Matters
This calculation assumes the close price’s position within the high-to-low range reflects the balance of buying and selling activity:
Close near the high: Most volume is buy volume.
Close near the low: Most volume is sell volume.
Close in the middle: Volume is split between buying and selling.
By breaking down volume in this way, the indicator helps traders identify key trends like accumulation (buying pressure) and distribution (selling pressure), making it a powerful tool for volume-based analysis.

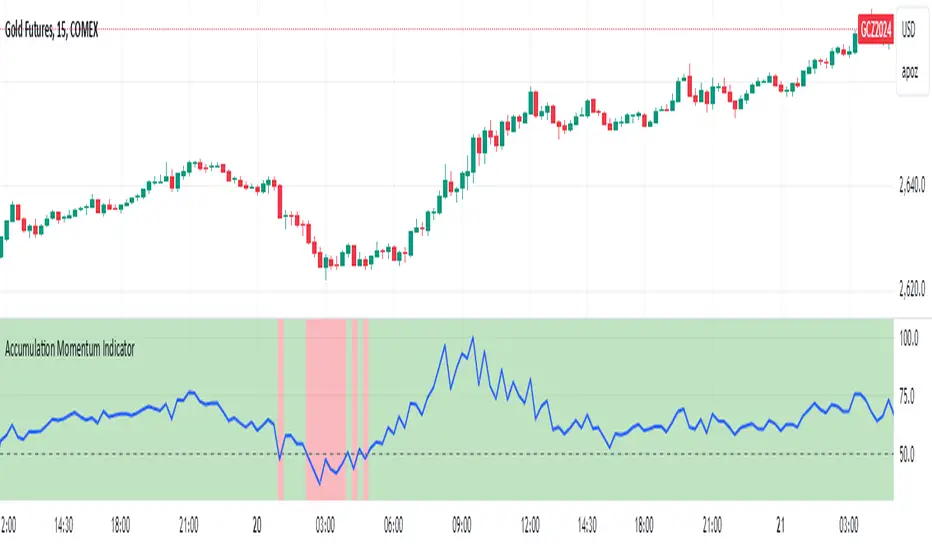
Accumulation Momentum IndicatorEveryone wants to be in a trend, I think this indicator does a great job at showing that key momentum that traders try and capitalize on everyday. I used a Stochastic Momentum Indicator (SMI) indicator. It's a lot like a slower MACD which allows me to capitalize on changing momentum. My goal was to make an indicator that was able to use a weighted mean of many accumulation/momentum indicators. This would give me a well rounded look to really see what direction the momentum and volume is heading.
I did some research on some of the best Accumulation and Momentum Indicators. I landed on 4.
The Accumulation Distribution line which measures the cumulative flow of money in or out of a security. It helps show how quickly money is going in and out of a commodity. The line moving up quickly indicates fast Accumulation while the A/C line is moving down quickly is shows falling Distribution. This can show the momentum and accumulation of a commodity in short and long term based off of Volume.
The On Balance Volume, OBV is a combination of Price Movement and Volume. If price closes higher then the previous bar volume is added while if the price closes lower volume is subtracted. This gives us an overall tally of whether volume is increasing with price or slowing down the momentum in the direction of the current trend. This gives us the ability to see if volume is supporting the price increasing (beginning/middle of a trend) or price is slowing down even though it is still heading in the direction of the current trend (signaling the end of the current trend).
The Force Index, this indicator measures the overall strength of the price movements. It does this by a calculation of price and volume. The close of the current bar subtracted by the previous multiplied by the volume. The result gives us either strong upward or downward motion. This adds magnitude to the overall movement/momentum of the indicator.
Lastly but most certainly not least is the Momentum indicator, (Price Momentum) a simple indicator that shows you the difference between the current close price and the close price from a specified period ago (Most commonly 14 periods/bars ago). Having this indicator is a must because it shows the speed at which price is accelerating or decelerating.
These 4 indicators together help round out the current volume, price movements, accumulation, and momentum of the current market. Since these indicators all have different scales and calculations I had to Normalize the Values to a 0-100 scale. This gives us 1 line and a much more readable easy to understand indicator. After they were normalized I gave them a weighted average that you can control. So lets say you cared more about the Force Index and the OBV rather then the Momentum and the Accumulation Distribution indicators, you would be able to give them more weight in the overall calculation as well as 0 out those you don't even want involved.
I hope the flexibility and the combination of 4 strong Accumulation Momentum indicators helps you better gauge the direction a commodity might head. The way it's used is when the Accumulation Momentum line is Above 50 buying pressure is stronger then selling pressure. An Accumulation Momentum line Below 50 suggests that distribution is more dominant in the current market. This indicator combines four different methods of analyzing price and volume to give you a single composite momentum score, making it easier to visualize when a commodity is being accumulated or distributed and how quickly this process is happening. It helps you track market sentiment based on both price movement and volume, with a clear, visual representation of buying and selling pressure.
Please let me know what you think and how you think I might be able to improve the script. Enjoy!
Effective Volume (ADV) v3Effective Volume (ADV) v3: Enhanced Accumulation/Distribution Analysis Tool
This indicator is an updated version of the original script by cI8DH, now upgraded to Pine Script v5 with added functionality, including the Volume Multiple feature. The tool is designed for analyzing Accumulation/Distribution (A/D) volume, referred to here as "Effective Volume," which represents the volume impact in alignment with price direction, providing insights into bullish or bearish trends through volume.
Accumulation/Distribution Volume Analysis : The script calculates and visualizes Effective Volume (ADV), helping traders assess volume strength in relation to price action. By factoring in bullish or bearish alignment, Effective Volume highlights points where volume strongly supports price movements.
Volume Multiple Feature for Volume Multiplication : The Volume Multiple setting (default value 2) allows you to set a multiplier to identify bars where Effective Volume exceeds the previous bar’s volume by a specified factor. This feature aids in pinpointing significant shifts in volume intensity, often associated with potential trend changes.
Customizable Aggregation Types : Users can choose from three volume aggregation types:
Simple - Standard SMA (Simple Moving Average) for averaging Effective Volume
Smoothed - RMA (Recursive Moving Average) for a less volatile, smoother line
Cumulative - Accumulated Effective Volume for ongoing trend analysis
Volume Divisor : The “Divide Vol by” setting (default 1 million) scales down the Effective Volume value for easier readability. This allows Effective Volume data to be aligned with the scale of the price chart.
Visualization Elements
Effective Volume Columns : The Effective Volume bar plot changes color based on volume direction:
Green Bars : Bullish Effective Volume (volume aligns with price movement upwards)
Red Bars : Bearish Effective Volume (volume aligns with price movement downwards)
Moving Average Lines :
Volume Moving Average - A gray line representing the moving average of total volume.
A/D Moving Average - A blue line showing the moving average of Accumulation/Distribution (A/D) Effective Volume.
High ADV Indicator : A “^” symbol appears on bars where the Effective Volume meets or exceeds the Volume Multiple threshold, highlighting bars with significant volume increase.
How to Use
Analyze Accumulation/Distribution Trends : Use Effective Volume to observe if bullish or bearish volume aligns with price direction, offering insights into the strength and sustainability of trends.
Identify Volume Multipliers with Volume Multiple : Adjust Volume Multiple to track when Effective Volume has notably increased, signaling potential shifts or strengthening trends.
Adjust Volume Display : Use the volume divisor setting to scale Effective Volume for clarity, especially when viewing alongside price data on higher timeframes.
With customizable parameters, this script provides a flexible, enhanced perspective on Effective Volume for traders analyzing volume-based trends and reversals.

Farley's Accumulation-Distribution Accelerator (ADA)Farley's ADA (From The Master Swing Trader)
What it is :
ADA is designed to track volume oscillations in the market and reduce the impact of shock events.
It observes the supply-demand dynamics within the market, which can trigger natural levels of price reversals.
How It Works
Volume and Price Relationship: ADA measures the lag between price and volume movements. It highlights when volume leads or lags behind price changes, helping traders identify potential reversals or trends.
Signal Generation: ADA can generate faster and cleaner signals compared to traditional indicators like On-Balance Volume (OBV).
Usage
Support and Resistance: ADA formations can help identify support and resistance levels and trendlines.
detect natural levels where price reversals might occur.
Trend Identification: Look for significant divergences between ADA and price action to identify potential trend reversals.
Volume Analysis: Use ADA to anticipate pauses in price movements when volume leads, and expect dynamic trends when ADA significantly moves ahead of price action.

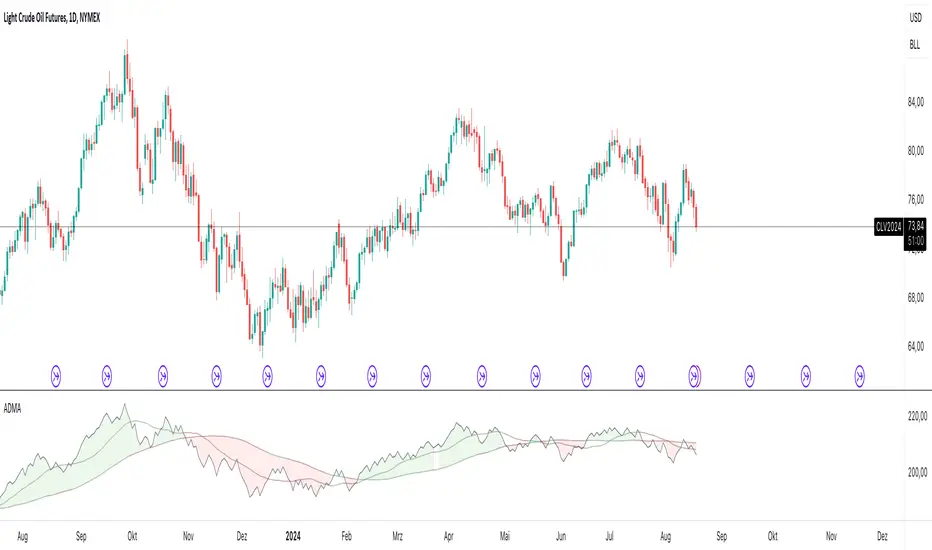
ADMAThe ADMA indicator is a technical analysis tool designed to identify trends and potential reversal points in a financial market. The indicator is based on the cumulative difference between the closing price and the high and low points of a candle. Two moving averages (MAs) are used to smooth the trend dynamics and generate clear signals.
Calculation:
The indicator calculates the trend as the cumulative difference between the current closing price and the maximum (or minimum) value of the current and previous candle, depending on market development.
The ADMA indicator is particularly useful for recognizing market dynamics and making trading decisions based on them. By using double smoothing, false signals are reduced, and the signals generated by the indicator are clear and easy to interpret. It is a flexible tool that can be adapted to different trading strategies.
FXN - Week and Day Separator midnight open. A simple modification of the regular FXN day separator indicator. It starts the days at 12:00 of the time-zone you select as opposed to the regular 17:00 server time.

Unlocking the Power of Long Candle MidpointI'm excited to share with you a fascinating concept that can help you identify potential breakout points in the market.
The Pine Script code provided below is designed to identify the midpoint of a long candle, which can be a crucial level for traders to watch.
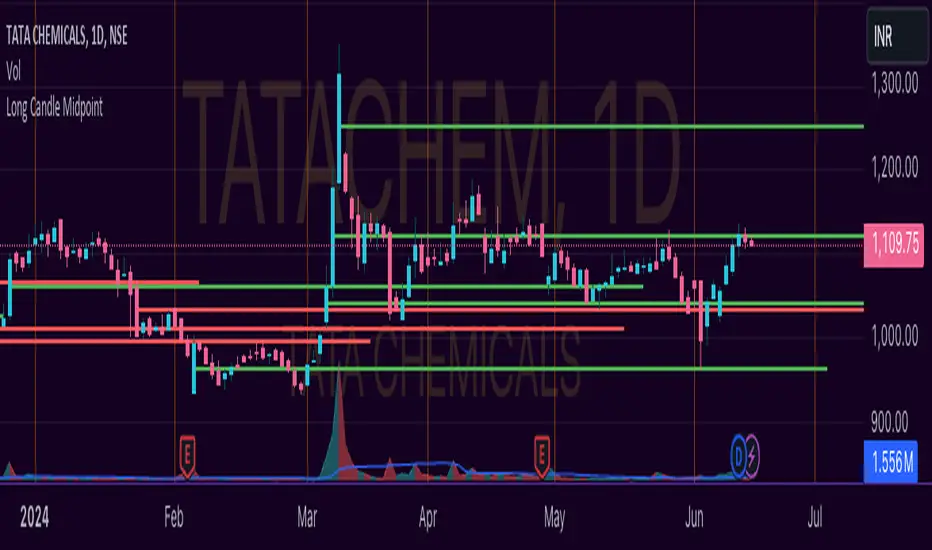
In this blog post, we'll dive deeper into the concept, explore its applications, and analyze a real-life example of TATACHEM listed on NSE, which is currently trading around a potential psychology line.
What is the Long Candle Midpoint?
The long candle midpoint is a technical indicator that calculates the midpoint of a candlestick that has a significant price movement. This midpoint is then used to draw a horizontal line, which can serve as a potential support or resistance level. The idea is that if a candlestick has a large price movement, it's likely that the market will react to this movement by testing the midpoint of the candle.
How Does the Long Candle Midpoint Indicator Work?
The Pine Script code provided above is designed to calculate the midpoint of a long candle based on the following parameters:
Length: The length of the candlestick is calculated using the len input parameter.
Line Length: The length of the line is calculated using the linExt input parameter.
Calculation Method: The calculation method can be set to either "Highest True Range", "Average True Range", or "Both".
Multiplier: The multiplier is used to adjust the midpoint calculation based on the average range of the candlestick.
The script then plots a horizontal line at the midpoint of the long candle, which can be used as a potential support or resistance level.
Real-Life Example:
Let's take a look at TATACHEM, a stock listed on the National Stock Exchange of India (NSE). As you can see in the chart below,
TATACHEM has been trading around a potential psychology line drawn from the midpoint of a large candle.
As you can see, the stock has previously failed to break above this line, but it's currently trading around it. This could be a sign that the market is preparing for a potential breakout. If the stock can break above this line, it could lead to a bullish rally.
Conclusion
The long candle midpoint indicator is a powerful tool that can help traders identify potential breakout points in the market. By analyzing the midpoint of a long candle, traders can gain insights into the market's sentiment and potential areas of support or resistance.
In the case of TATACHEM, the stock is currently trading around a potential psychology line, which could be a sign of a potential breakout. Traders can consider this point in their watch list for a potential entry. Tips for Traders
Use the long candle midpoint indicator in conjunction with other technical indicators to gain a more comprehensive understanding of the market.
Look for confirmation from other indicators before entering a trade.
Set stop-loss and take-profit levels based on the potential breakout point.
Monitor the market closely and be prepared to adjust your strategy if the market doesn't behave as expected.
By incorporating the long candle midpoint indicator into your trading strategy, you can gain an edge in the market and make more informed trading decisions.
Global Net Liquidity (TG fork)Worldwide net liquidity, with trend coloring.
Global Net Liquidity attempts to represent worldwide net liquidity, and is defined as: Fed + Japan + China + UK + ECB - RRP - TGA , Where the first five components are central bank assets.
On TradingView, the indicator can be reproduced with the following equations: Global Net Liquidity = FRED:WALCL + FRED:JPNASSETS * FX_IDC:JPYUSD + CNCBBS * FX_IDC:CNYUSD + GBCBBS * FX:GBPUSD + ECBASSETSW * FX:EURUSD + RRPONTSYD + WTREGEN
However, this indicator adds a moving average cloud, and margin coloring, which eases historical trend assessment at a glance.
This indicator can be seen as an alternative representation of the accumulation/distribution indicator (and hence the same terms can be used in this description).
The Moving Average Cloud is simply the filling between the moving average (by default an EMA) and the current value. This feature was inspired by D7R ACC/DIST closed-source indicator, kudos to D7R for making such neat visual indicators.
Usage instructions:
Blue is more likely a phase of accumulation because the current value is above its historical price as defined by the moving average,
red is when this is more likely a phase of distribution.
Yellow is when the difference is below the margin, so we consider it is insignificant and that the trend is undecided. This can be disabled by setting the margin to 0.
While the color indicates if it's more likely an accumulation (blue) or distribution (red) phase or undecided (yellow), the cloud's vertical size allows to assess the strength of this tendency and the horizontal size the momentum, so that the bigger the cloud, the stronger the accumulation (if cloud is blue) or distribution (if cloud is red).
Why is that so? This is because the cloud represents the difference between the current tendency and the moving averaged past one, so a bigger cloud represents a bigger departure from recently observed tendencies. In practice, when there is accumulation, a pump in price can be expected soon, or if it already happened then it means it is indeed supported by volume, whereas if distribution, either a dump is to be expected soon, or if it already happened it means it's supported by volume.
Or maybe not necessarily a dump, but if there is a move upward in price, but the indicator indicates a strong distribution, then it means that the price movement is not supported and may not be sustainable (reversal may happen at anytime), whereas if price is going upward AND there is an accumulation (blue coloring) then it is more sustainable. This can be used to adapt strategies accordingly (risk on/risk off depending on whether there is concordance of both price and accumulation/distribution).
This indicator also includes sentiment signals that can be used to trigger alarms.
This indicator is a remix of Dharmatech's, who authored the first this Global Net Liquidity equation, kudos to them! Please show them some love if you like this indicator!

Williams Percent Range with Trendlines and BreakoutsHere is my "Williams Percent Range with Trendlines and Breakouts" indicator, a simple yet powerful tool for traders. This indicator combines the classic Williams %R oscillator, which helps identify overbought and oversold levels, with added trendlines for easier trend analysis at a glance.
It's designed to make spotting potential breakouts easier by drawing attention to significant price movements. With customizable settings for the Williams %R period and trendline sensitivity, it's a flexible tool for various symbols and trading styles.
Whether you're looking to refine your trading strategy or just need a clearer view of market trends, this indicator should offer a straight forward approach to hopefully enhance your trading decisions.
Disclaimer: This indicator is intended for educational and informational purposes only. Always conduct your own research and analysis before making trading decisions.

Accumulation/Distribution Money Flow v1.0This indicator is intended to measure selling and buying pressure, calculates accumulation/distribution levels and suggests current trend intensity and direction.
Core calculations are based on open source script by cI8DH which was not updated ever since 2018. Also, it implements the technique to avoid price gaps issues as described in Twiggs® Money Flow .
The indicator can plot calculated A/D line, a smoothed A/D line and another smoother derivative from the smoothed line which serves as a signal line. By implementing crossovers detection between two lines and also measuring distance between them it plots the histogram of the difference and can also color chart bars accordingly.
You can also use settings to factor in price and/or volume into calculations.
Three options for visual color representation are available.
1) Simple color bars
In this case bars are colored in red and green by default, whereas green indicates positive distance between smoothed A/D line and signal line (upward movement), and red indicated negative distance (downward movement).
2) 4-color scheme
In this case pale green and pale red colors are added, whereas pale red used when the histogram is positive and A/D + signal lines are below zero lines (start of upward movement from lower levels), and pale green is where histogram is negative and both A/D and signal lines are above zero line (start of downward movement from top levels). Bright red and green colors indicate strong movement where the position of A/D + signal lines correspond to positive and.or negative histogram values. This option allows to visually track trend intensity more precisely.
3) Gradient bars color
In this scheme the candles are colored using gradient of either red or green color depending on the intensity and direction of the trend. For that color scheme you must specify the lookback parameter indicating number of bars back to determine highest/lowest values.

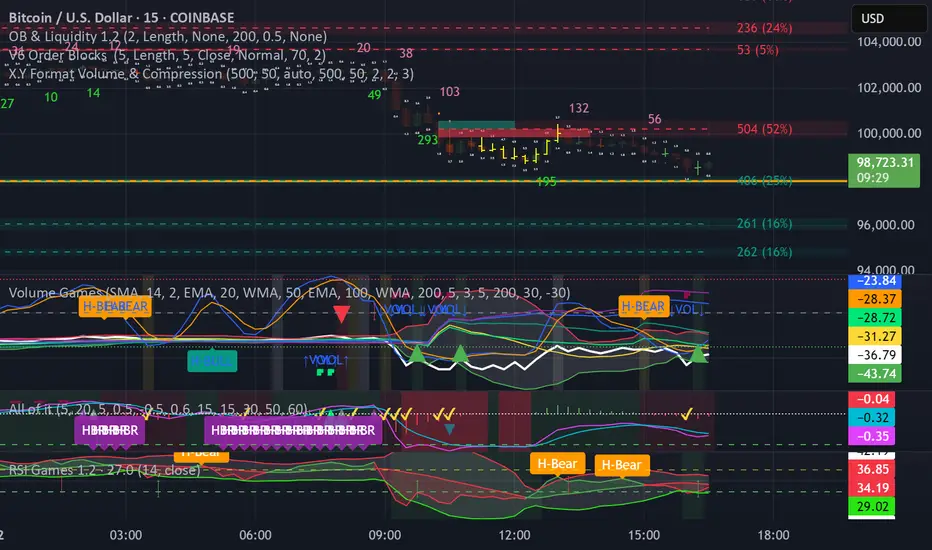
NormInvTargetSeekerNormInvTargetSeeker
The NormInvTargetSeeker is a trading tool designed to aid traders in identifying and capitalizing on Distribution and Accumulation zones, highlighting specific price levels that could serve as targets for future price movements. Although the indicator itself is not multi-timeframe, an effective trading strategy might involve signal validation across multiple timeframes.
🔶 USAGE
The indicator identifies Distribution and Accumulation zones, providing potential targets for future price moves.
Traders are encouraged to use these zones as profit targets or potential reversal points.
Confluence Zones
These zones are identified as regions where various factors or levels converge, signaling an increased probability of price reaction.
They can be used to reinforce signals or identify levels where price might encounter significant resistance or support.
🔹 Trading Strategy
First, identify a signal on your primary trading timeframe.
Manually check higher timeframes to ensure the signal aligns with them.
Use the identified zones, whether Distribution or Accumulation, as target zones for your trades.
🔶 Order Blocks
The NormInvTargetSeeker identifies "Order Blocks" by examining a specified number of consecutive candles with a specific condition: the current candle must completely engulf the previous candle. This means that both the high and low of the current candle are higher and lower, respectively, than the high and low of the previous candle, signifying a dominant move in the direction of the current candle.
🔹 Trading Strategy
Target Confirmation: Order Blocks can serve to confirm target points, providing additional validation for identified levels.
Market Insight: They offer crucial insights into whether "big hands" or institutional players are positioned as buyers or sellers in the market.
Traders can use Order Blocks as a means to validate targets or key price levels, observing if the price reacts significantly upon reaching these blocks.
They can also provide insights into the general market direction or underlying market strength by identifying where the major market players are placing their orders.
🔶 SETTINGS
The indicator allows users to adjust various parameters to customize the display and logic of the tool to fit their needs.
🔹 Display Settings
Users can customize the colors and displays of various zones and labels to match their preferences.
🔶 LICENSE AND CREDITS
This work is licensed under Attribution-NonCommercial-ShareAlike 4.0 International (CC BY-NC-SA 4.0). More information here: creativecommons.org
This indicator utilizes a TypeScript implementation of the Normal Inverse function as a reference, which can be found here : github.com
Special thanks to the authors of the referenced code for providing a foundation upon which this indicator was built.
🔶 UPDATES
Current Version: 1.0.0
For future updates, please check the comment section.
🔶 CONTACT
For any questions or suggestions, please feel free to contact @RickSimpson on TradingView.

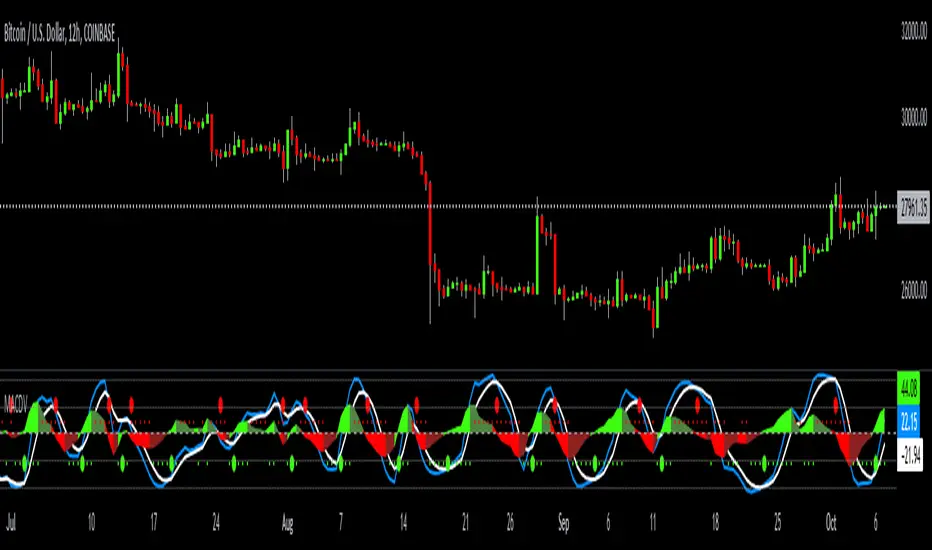
MACDVMACDV = Moving Average Convergence Divergence Volume
The MACDV indicator uses stochastic accumulation / distribution volume inflow and outflow formulas to visualize it in a standard MACD type of appearance.
To be able to merge these formulas I had to normalize the math.
Accumulation / distribution volume is a unique scale.
Stochastic is a 0-100 scale.
MACD is a unique scale.
The normalized output scale range for MACDV is -100 to 100.
100 = overbought
-100 = oversold
Everything in between is either bullish or bearish.
Rising = bullish
Falling = bearish
crossover = bullish
crossunder = bearish
convergence = direction change
divergence = momentum
The default input settings are:
7 = K length, Stochastic accumulation / distribution length
3 = D smoothing, smoothing stochastic accumulation / distribution volume weighted moving average
6 = MACDV fast, MACDV fast length line
color = blue
13 = MACDV slow, MACDV slow length line
color = white
4 = MACDV signal, MACDV histogram length
color rising above 0 = bright green
color falling above 0 = dark green
color falling below 0 = bright red
color rising below 0 = dark red
2 = Stretch, Output multiplier for MACDV visual expansion
Horizontal lines:
100
75
50
25
0
-25
-50
-75
-100
On-Balance Accumulation Distribution (Volume-Weighted)The On-Balance Accumulation Distribution (OBAD) indicator is designed to analyze the accumulation and distribution of assets based on volume-weighted price movements. The indicator helps traders identify periods of buying and selling pressure and assess the strength of market trends. By incorporating volume and price data, the OBAD indicator provides valuable insights into the flow of funds in the market.
To calculate the OBAD, the indicator multiplies the volume, price, and volume factor (user-defined) with the price change and aggregates the values over a specified length. This results in a histogram and a line plot representing the OBAD values. The OBAD signal line is derived by applying a simple moving average (SMA) to the OBAD values over a shorter period (9 by default). The crossover of the OBAD line and signal line can indicate potential entry or exit points.
The OBAD indicator utilizes coloration to enhance its visual representation and interpretation. The OBAD background is colored based on the relationship between the OBAD values and the OBAD signal line. When the OBAD values are above the signal line, the background is displayed in lime, suggesting a bullish accumulation scenario. Conversely, when the OBAD values are below the signal line, the background is colored fuchsia, indicating a bearish distribution pattern. The bar coloration is also applied to provide further visual cues, with lime representing bullish conditions and fuchsia denoting bearish conditions. When the OBAD signal line is above 0, it is colored green. Conversely, if the signal line is below 0, it is colored maroon.
The length parameter in the OBAD indicator determines the number of periods used in the calculation. Shorter lengths, such as 10 or 20, can make the indicator more responsive to recent price and volume changes, providing quicker signals. This can be beneficial for short-term traders or in fast-paced markets. Conversely, longer lengths, such as 50 or 100, smooth out the indicator and provide a broader view of accumulation and distribution over a more extended period. This may suit longer-term traders or when analyzing trends in less volatile markets. Traders should experiment with different lengths to find the optimal balance between responsiveness and smoothness that aligns with their trading goals.
The volume factor parameter allows traders to adjust the weighting of volume in the OBAD calculation. By modifying this factor, traders can emphasize the impact of volume on the indicator. Increasing the volume factor amplifies the influence of volume in the OBAD calculation, making it more sensitive to volume changes. This can be advantageous when volume is considered a significant driver of price movements, such as during news events or market catalysts. On the other hand, decreasing the volume factor reduces the impact of volume, making the indicator less sensitive to volume fluctuations. Traders can experiment with different volume factors to align the indicator's responsiveness with their analysis of volume patterns and its importance in their trading decisions.
The signal line period parameter determines the number of periods used to calculate the moving average of the OBAD values. Adjusting this parameter can help smooth out the indicator and filter out short-term noise or provide more timely signals. A shorter signal line period, such as 5 or 7, provides more sensitive and frequent crossovers with the OBAD values, potentially offering early entry or exit signals. This can be useful for traders seeking shorter-term trades or more agile trading strategies. Conversely, a longer signal line period, such as 9 or 14, smooths out the indicator and provides more stable signals. This may suit traders who prefer longer-term trends or a more conservative approach. Traders should consider their trading timeframe and the desired balance between responsiveness and stability when adjusting the signal line period.
The OBAD indicator can be applied in various trading strategies and scenarios. It helps traders identify potential trend reversals, confirm existing trends, and generate entry and exit signals. For example, when the OBAD histogram transitions from fuchsia to lime, it may suggest a shift from selling to buying pressure, signaling a potential buying opportunity. Traders can also use the OBAD indicator in conjunction with other technical analysis tools, such as trendlines or support/resistance levels, to confirm signals and make more informed trading decisions.
-- Trend Reversal Identification : The OBAD indicator can be useful in identifying potential trend reversals. When the OBAD values cross above the signal line after being below it, it may suggest a shift from bearish distribution to bullish accumulation. Conversely, when the OBAD values cross below the signal line after being above it, it may indicate a transition from bullish accumulation to bearish distribution. Traders can use these crossovers as potential signals to enter or exit trades in anticipation of a trend reversal.
-- Confirmation of Trend Strength : The OBAD indicator can act as a confirmation tool for assessing the strength of existing trends. When the OBAD values remain consistently above the signal line, it confirms the presence of strong bullish accumulation and validates the upward trend. Similarly, when the OBAD values stay consistently below the signal line, it confirms the presence of strong bearish distribution and validates the downward trend. Traders can use this confirmation to have more confidence in the prevailing trend and adjust their trading strategies accordingly.
-- Divergence Analysis : Divergence between the price and the OBAD indicator can provide valuable insights. Bullish divergence occurs when the price forms lower lows while the OBAD indicator forms higher lows, suggesting a potential trend reversal to the upside. Conversely, bearish divergence occurs when the price forms higher highs while the OBAD indicator forms lower highs, indicating a potential trend reversal to the downside. Traders can use these divergences as additional confirmation signals in their trading decisions.
-- Volume Analysis : The OBAD indicator incorporates volume data, making it particularly useful for volume analysis. Traders can analyze the relationship between OBAD values and volume levels to gauge the strength and validity of price movements. Higher OBAD values accompanied by higher volume can indicate strong accumulation or distribution, providing confirmation for potential trade setups. On the other hand, lower OBAD values accompanied by low volume may suggest a lack of participation and potentially signal caution in trading decisions.
It is important to note that the OBAD indicator, like any other technical indicator, has certain limitations. It relies on historical price and volume data, which may not always accurately reflect current market conditions or future price movements. Traders should exercise caution and use the OBAD indicator in conjunction with other analysis techniques and risk management strategies. Additionally, customization of the OBAD parameters, such as adjusting the length or volume factor, can provide flexibility to adapt the indicator to different market conditions and trading preferences.
Overall, the OBAD indicator serves as a valuable tool for traders to gauge the accumulation and distribution patterns in the market. Its calculation based on volume-weighted price movements and the coloration enhancements make it visually appealing and intuitive to interpret. By incorporating the OBAD indicator into trading strategies and considering its limitations, traders can potentially improve their decision-making process and enhance their trading outcomes.

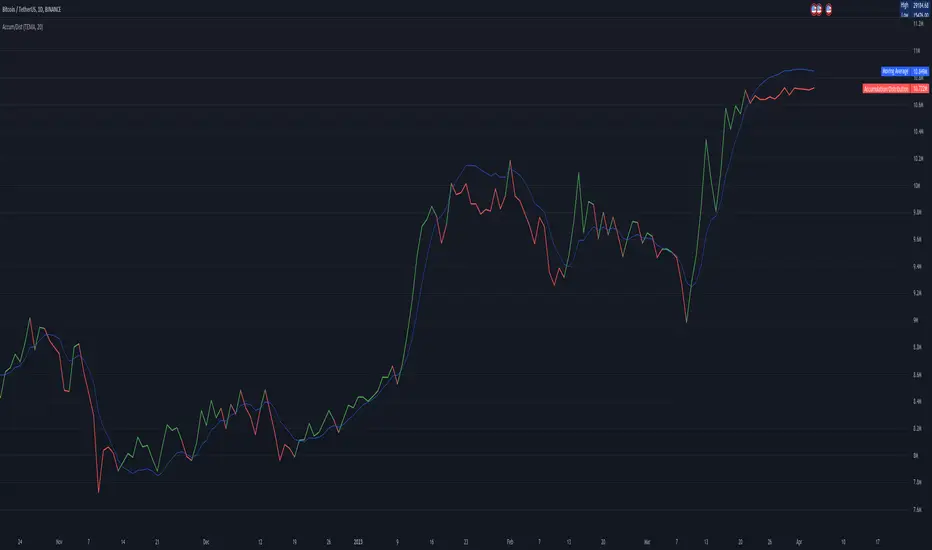
Accumulation/DistributionAccumulation/Distribution explains when the big players buy or sell, according to Wyckoff.
I added some colors to make it more visibly, to get a hint when (not) to invest.
A/D is a lagging indicator.
When the MA is above A/D line, this should reflect distribution time, and big players are selling.
The oppsite is when MA is below the A/D line, then this should be an accumulation phase, and big players are buying.
For example, my preference is a TEMA20 for crypto, this gives me good results.
But I added a bunch of moving averages to choose from.
Depending on preferences/marked you can choose a moving average, set its length, and you can choose all the colors too.
I recommend the Volume indicator to setup the MA line, and this will get much better results!
I hope this script will help some people to do some better decisions.
And I am pleased to get some advice to make this script even better!
There is only one similar-sounding script in the public section.
Kudos go to jbneto with his Accum/ Dist + 200 EMA which gave me the inspiration.
It has a EMA200, and its focus is on the daily pivot price.
Volume DockThis oscillator has two different modes:
The first one called RSIs is a comparison between the Relative strength index of the Accumulation/Distribution (and the On Balance Volume) and the normal price, to analyze the differences in momentum between the price with volume and without.
The second one, called Dock, is similar except for the fact that the lines are smoothed using the hull moving average formula, this mode is great to signal entries and for reversal analyzing.

The On Balance Volume & Accumulation Distribution RibbonMedic trades using "Smart Money Concepts", and Medic's system revolves around the one taught by MentFX (i.e. Structure, Supply/ Demand Zone , and Confirmation). While this system per se doesn't require the use of a volume indicator, Medic has come to respect the OBV and Accumulation / Distribution .
The OBV Ribbon is available in many a shape and form, but Medic wanted something more responsive, and the OBVAD is just that.
This ribbon works across all time frames, and allows users to visualize what is happening behind the scenes of The Trigger indicator.
The Ribbon applies 11 DEMA of different periods to the cumulative sum of SpaceTrader's OBV/AD formula: volume*(close-open)/( high-low )*hlc3.
The Ribbon is able to identify the general trend, and changes into a blu ein an uptrend, and purple in a downtrend, and also potential reversals by means of divergences.

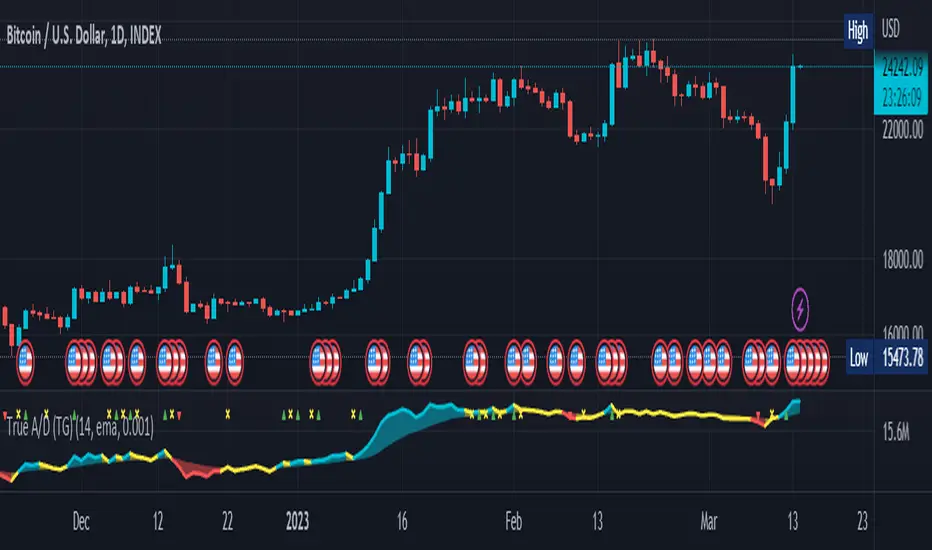
True Accumulation/Distribution (TG fork)An accumulation/distribution indicator that works better against gaps and with trend coloring.
Accumulation/Distribution was developed by Marc Chaikin to provide insight into strength of a trend by measuring flow of buy and sell volume .
The fact that A/D only factors current period's range for calculating the volume multiplier causes problem with price gaps. They are ignored or even misinterpreted.
True Accumulation/Distribution solves the problem by using True Range instead of only relying on current period's high and low.
Most of the time, True A/D reverts to producing the same values as the original A/D. The difference between True A/D and original A/D can be better seen when a gap has occurred, True A/D has handles it better than Accumulation/Distribution which a bearish close in period's range cause it to misinterpret the strong buy pressure as sell volume
The Moving Average Cloud is simply the filling between the moving average and the True A/D. This feature was inspired by D7R ACC/DIST closed-source indicator, kudos to D7R for making such neat visual indicators (but unfortunately all closed source!).
This indicator was made to extend the original work by adding MTF support and a moving average cloud and coloring.
If you like this indicator, please show the original author RezzaHmt some love:
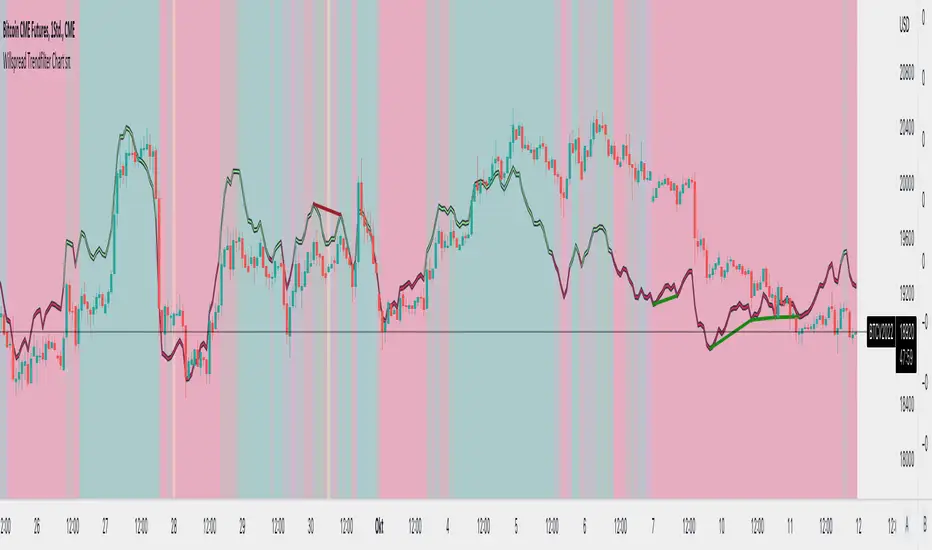
Willspread Chart + POIV & ADVolumen TrendColor sπThe Indicator is a combination of different types of measurements to the Price Action.
1. Spread: The Spread is set to measure your Symbol to another chosen Market like Dollar as Contra . But you can switch also between different markets.
2. Accumulation/Distribution with True Range of High or Low including OpenInterest. This only works with Futures .
--Energies, Metals, Bonds, Softs, Currencies, Livestock, live cattle , feeder cattle, lean hogs , index--
Open Interest for:
ZW, ZC, ZS, ZM, ZL, ZO, ZR, CL, RB, HO, NG, GC, SI, HG, PA, PL, ZN, ZB, ZT, ZF, CC, CT, KC, SB, JO, LB, AUDUSD, GBPUSD, USDCAD, EURUSD, USDJPY, USDCHF, USDMXN, NZDUSD, USDRUB, DX, BTC, ETH, LE, GF, HE, NQ, NDX, ES, SPX, RTY, VIX,
3. Accumulation/Distribution with True Range of High or Low including Volume .
4. The color shows if the Market has positive or negative (Willspread, Volume or Open Interest)
5. The Indicator also shows Divergences to Price and Willspread Movements.
If you want to have more information just give me a message.
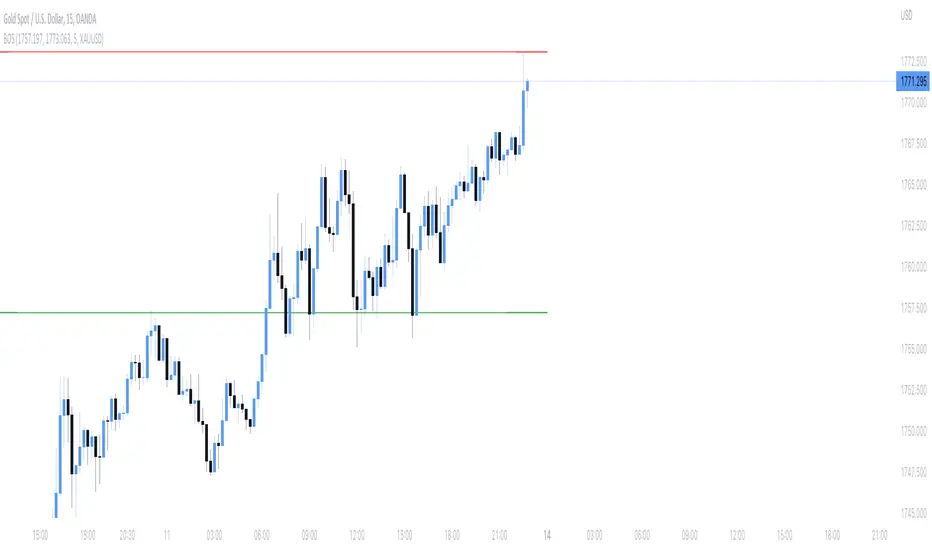
Average Daily Range (ADR) (Multi Timeframe, Multi Period)Average Daily Range (ADR)
(Multi Timeframe, Multi Period, Extended Levels)
Tips
• Narrow Zones are an indication of breakouts. It can be a very tight range as well.
• Wider Zones can be Sideways or Volatile.
What is this Indicator?
• This is Average Daily Range (ADR) Zones or Pivots.
• This have Multi Timeframe, Multi Period (Up to 3 Levels) and Extended Target Levels.
Advantages of this Indicator
• This is a Leading indicator, not Dynamic or Repaint.
• Helps to identify the reversal points.
• The levels are more accurate and not like the old formulas.
• Can practically follow the Buy Low and Sell High principle.
• Helps to keep minimum Stop Loss.
Who to use?
• Highly beneficial for Day Traders
• It can be used for Swing and Positions as well.
What timeframe to use?
• Any timeframe.
When to use?
• Any market conditions.
How to use?
Entry
• Long entry when the Price reach at or closer to the Green Support zone.
• Long entry when the Price retrace to the Red Resistance zone.
• Short entry when the Price reach at or closer to the Red Resistance zone.
• Short entry when the Price retrace to the Green Support zone.
• Long or Short at the Pivot line.
Exit
• Use past ADR levels as targets.
• Or use the Target levels in the indicator for breakouts.
• Use the Pivot line as target.
• Use Support or Resistance Zones as targets in reversal method.
What are the Lines?
Gray Line:
• It the day Open or can be considered as Pivot.
Red & Green ADR Zones:
• Red Zone is Resistance.
• Green Zone is Support.
• Mostly price can reverse from this Zones.
• Multiple Red and Green Lines forms a Zone.
• These lines are average levels of past days which helps to figure out the maximum and minimum price range that can be moved in that day.
• The default number of days are 5, 7 and 14. This can be customized.
Red & Green Target Lines:
• These are Target levels.
What are the Labels?
• First Number: Price of that level.
• Numbers in (): Percentage change and Change of price from LTP (Last Traded Price) to that Level.
General Tips
• It is good if Stock trend is same as that of the Index trend.
• Lots of indicators creates lots of confusion.
• Keep the chart simple and clean.
• Buy Low and Sell High.
• Master averages or 50%.

Volume Risk Avoidance IndicatorPrice Pattern Analysis is the core of trading. But price patterns often fails.
VRAI (Volume Risk Avoidance Indicator) shows Volume Pressure, so that you can avoid volume-based risks.
For example, never short when you see green (buying pressure). Never long when you see red (selling pressure).
You still need to pick good price patterns, because the crossover of volume pressure is not reliable.
Enjoy!

Break of structure indicatorThis indicator allows you to set a range of price which you want to get an alert about if price breaks that structure.
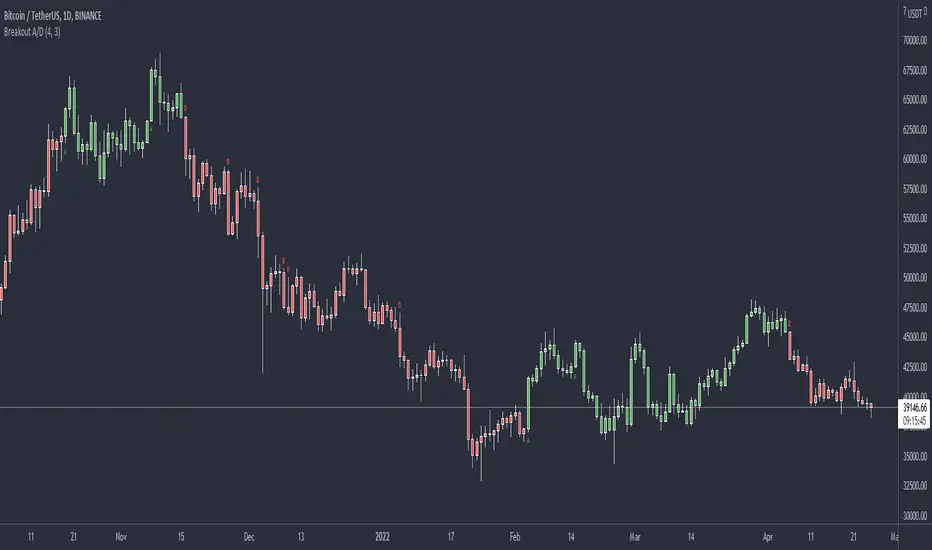
Breakout Accumulation/DistributionBasic modification of my SFP Momentum Indicator showing accumulation/distribution patterns based on breakouts above previous anchor points.
Candles are colored based on whether accumulation or distribution was last.
Best if used at HTF then confirmed at LTF.