ICT Fair Value Gap (FVG) Detector │ Auto-Mitigated │ 2025Accurate ICT / Smart Money Concepts Fair Value Gap (FVG) detector
Features:
• Detects both Bullish (-FVG) and Bearish (+FVG) using strict 3-candle rule
• Boxes automatically extend right until price mitigates them
• Boxes auto-delete when price closes inside the gap (true mitigation)
• No repainting – 100% reliable
• Clean, lightweight, and works on all markets & timeframes
• Fully customizable colors and transparency
How to use:
– Bullish FVG (green) = potential support / buy zone in uptrend
– Bearish FVG (red) = potential resistance / sell zone in downtrend
Exactly matches The Inner Circle Trader (ICT) methodology used by thousands of SMC traders in 2024–2025.
Enjoy and trade safe!
Action

Adaptive Support and Resistance LevelsAdaptive Support and Resistance Levels
This indicator is a comprehensive institutional-grade trading tool designed to visualize Auction Market Theory (AMT), Support and Resistance concepts directly on the price chart. It is built for traders who require a deep understanding of market structure without the visual clutter of standard retail indicators.
Key Features:
1] Fractal Adaptive Engine:
The indicator automatically adjusts its calculations based on your timeframe.
-Intraday (1m-15m): Displays Daily Levels.
-Swing/Positional (30m-1H): Displays Weekly Levels.
-Long Term (Daily+): Displays Monthly Levels.
2]Untested Levels:
-Identifies levels from previous sessions that have not been tested by price.
-Extends these levels forward as "Magnets" until price touches them.
-Touch-Delete Logic: Once price interacts with a magnet, the line is automatically removed to keep the chart clean.
3] Institutional Dashboard:
- A "Flight Deck" table in the top-right corner provides real-time metrics:
-Context: Are we inside, above, or below the previous value zone?
-Auction State: Is the current market balanced or imbalanced?
-IB Status: Initial Balance (first 60 mins) breakout/breakdown status.
-Fuel Gauge: Measures current range vs. ADR (Average Daily Range) to gauge exhaustion.
-Volume Flow: Detects high-aggression volume relative to the average.
How to Use:
Trend Following: Look for price breaking out of the (Static Lines) , Pullback rejection, Rejection from the lines.
Reversion: Use the lower lines for bulls reversal and Upper lines for bears reversal ( Kind of reversal candle formation )
Risk Management: Use the ADR Fuel Gauge to avoid buying extended markets (>100% ADR).
Disclaimer: This tool is only for educational and analytical purposes only. Not any recommendation.

Titan EMA Liquidity [Stansbooth]
🔥 Precision EMA + FVG Liquidity Sweep System
Advanced Buy/Sell Signal Engine for High-Probability Trade Entries
Unlock a new level of precision with this all-in-one market structure indicator built for traders who demand accuracy, clarity, and confidence.
This tool combines EMA trend filtration , Fair Value Gap (FVG) detection , and liquidity sweep analysis to deliver powerful buy and sell signals that align with institutional price behavior.
✅ Key Features
Dynamic EMA Trend Filter:
Identifies true trend direction and filters out low-quality trades. Signals only trigger when momentum aligns with higher-timeframe directional bias.
Smart FVG Detection:
Automatically highlights bullish and bearish Fair Value Gaps, helping you spot premium/discount zones where institutional traders seek entries.
Liquidity Sweep Identification:
Detects equal highs/lows, stop hunts, and engineered liquidity grabs—then confirms reversals when price sweeps liquidity and returns inside structure.
High-Accuracy Signal Engine:
Buy/Sell alerts trigger only when three layers agree:
1. EMA trend alignment
2. FVG confirmation
3. Liquidity sweep completion
This results in cleaner signals , fewer false entries, and strong trend continuation setups.
Optimized for All Market Conditions:
Works for scalping, day trading, and swing trading across Forex, Crypto, Indices, and Stocks.
What This Indicator Helps You Achieve
Capture smart-money style entries with reduced drawdown
Enter after liquidity grabs instead of before them
Avoid chop with EMA-filtered market direction
Spot precision premium/discount zones using automatic FVG mapping
Obtain high-confidence Buy/Sell signals based on institutional concept
Why Traders Love It
This system isn’t just another signal generator—it’s a market-structure aware model that reads the chart the same way professional traders do.
Every signal is based on probability stacking , giving you the clarity and confidence to take the best setups while ignoring noise.

9/15 EMA Scalper 9/15 EMA Scalper — by uzairbaloch
This script is a price-action based scalping system built around the 9 EMA and 15 EMA trend structure.
It identifies short-term reversal points where the market pulls back into the EMAs and confirms direction with a strong candle signal.
The strategy looks for:
• A clear EMA trend (9 above 15 for buys, 9 below 15 for sells)
• Pullback into EMA9/EMA15 with candle bodies touching the fast EMA
• Strong confirmation candle (engulfing / strong momentum / controlled wick)
• Optional slope filter to avoid flat, choppy sessions
• Automatic trade labels showing Entry, SL and TP (based on R:R)
The script is designed for scalping on gold, indices, and high-volatility FX pairs.
It resets trade logic immediately after SL or TP is hit, so it can catch the next valid signal without delay.
This tool is meant as an indicator — not a full strategy — and can be used to visually mark high-probability EMA pullback setups with precise levels.
Author: uzairbaloch

Liquidity ThermometerThis is a universal indicator that assesses market liquidity based on five key market parameters: volume, volatility, candlestick range, body size, and price momentum.
The indicator does not use open interest data and is suitable for all markets, including spot, futures, and Forex.
This indicator normalizes each metric historically and creates a composite index between 0 and 1, where higher values correspond to a stable and calm market environment, and lower values indicate periods of increased risk and potential liquidity stress.
LT generates an integral liquidity index in the range based on five normalized components:
-nVol — normalized volume, reflecting trading density and activity.
-nATR — the volatility component (ATR), inverted, as high volatility is typically associated with declining liquidity.
-nRange — the normalized candlestick range, also inverted to assess the structural narrowness of the price movement.
-nBody — the normalized candlestick body size (|close − open|), inverted to assess the balance of supply and demand.
-nMove — the normalized value of the price impulse movement (|Δclose|), reflecting short-term price spikes.
Each metric is linearly normalized over a sliding window (200 bars) using the formula:
norm(x) = (x − min) / (max − min),
where at max = min, the value is fixed at 0.5 to ensure stability.
The ALT index is calculated as a weighted combination:
ALT = 0.35 nVol + 0.20 (1 − nATR) + 0.20 (1 − nRange) + 0.15 (1 − nBody) + 0.10 (1 − nMove)
The result is further smoothed using EMA(3) to reduce micronoise.
Red Zone (MLI < 0.25) — Risk, Thin Liquidity
When the indicator falls into the red zone, it means the market is extremely volatile:
Characteristics:
Low volume — small trades have a strong impact on the price.
High volatility — candlesticks rise or fall sharply.
Wide candlestick range — the market is "breathing heavily," easily breaking price extremes.
Impulsive movements — small market shocks lead to sharp spikes.
Thin liquidity — few orders in the order book, large orders "eat up" the market.
What this means for a trader:
🔥 High risk of spikes and false breakouts.
⚠ Possible series of liquidations on leverage.
❌ It is not recommended to enter long or short positions without a filter or protection.
✅ Can be used for short scalping strategies if you know the entry point, but very carefully.
Green Zone (MLI > 0.75) — High Liquidity, Safe Zone
When the indicator rises into the green zone, it means the market is stable and balanced:
Characteristics:
High volume — the market is deep, orders are executed without a strong impact on the price.
Low volatility — candlesticks are stable, no sharp spikes.
Narrow candlestick range — price moves calmly.
Weak impulse movements — no sharp surges.
Sufficient liquidity — the market can handle large orders.
What this means for a trader:
✅ Safe zone for opening positions.
🔄 Easier to set stop-loss and take-profit orders.
💡 You can trade both up and down, the risk of sharp movements is minimal.
⚡ Under these conditions, there is a lower risk of spikes and accidental liquidations.
It does not predict price movements or guarantee results. It is an analytical tool intended for additional research into market structure.

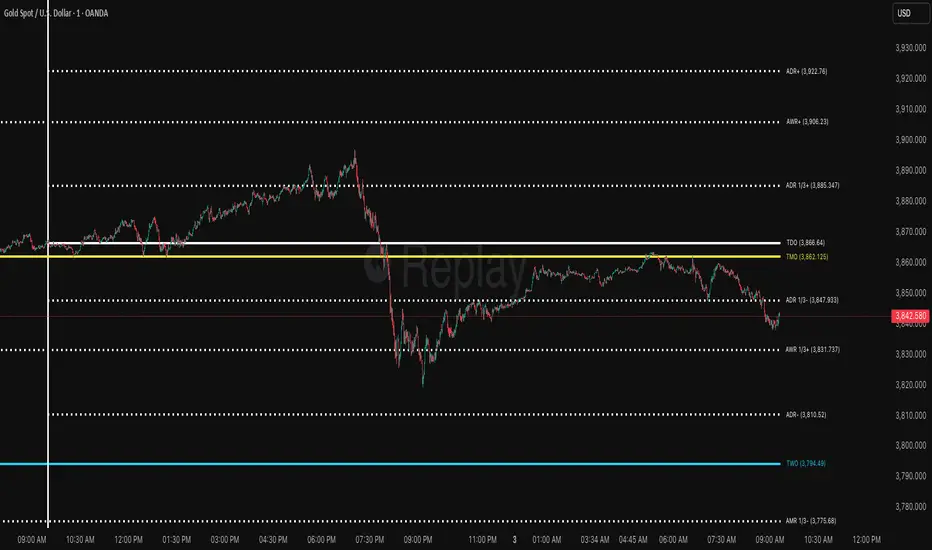
ICT ADR/AWR/AMR Levels | Trade Symmetry🌟 ICT ADR/AWR/AMR Levels
📋 Overview
This advanced technical analysis tool calculates and displays Average Daily Range (ADR), Average Weekly Range (AWR), and Average Monthly Range (AMR) levels. The indicator incorporates smart detection technology that automatically maintains monthly level visibility when historical data becomes unavailable.
✨ Key Features
🕒 Precise Time Alignment
True Daily Opens (TDO) aligned with 00:00 UTC
True Weekly Opens (TWO) at 00:00 UTC (configurable Monday/Sunday start)
True Monthly Opens (TMO) at 00:00 UTC on month start
Customizable period start times and parameters
📊 Comprehensive Multi-Timeframe Analysis
Daily Levels (ADR): Base level with multiple extensions including Fibonacci ratios
Weekly Levels (AWR): Weekly range projections and key levels
Monthly Levels (AMR): Monthly range calculations with automatic fallback system
🔄 Intelligent Level Management
Smart Detection: Automatically switches between historical and current monthly levels
Continuous Visibility: Ensures reference levels remain visible regardless of data availability
Seamless Operation: No manual adjustment needed for level transitions
⚙️ Extensive Customization
Adjustable lookback periods for all timeframes
Independent control over each level type and extension
Complete visual customization (colors, styles, widths)
Flexible labeling and display options
Configurable vertical separation lines
🏷️ Advanced Display Options
Clean, organized label placement
Optional price display in labels
Historical period tracking
Overlapping label merging capability
Adjustable label sizing and positioning
🚀 How to Use
Initial Setup: Enable desired timeframes (Daily/Weekly/Monthly)
Range Configuration: Set appropriate averaging periods for each timeframe
Level Selection: Choose which extension levels to display
Visual Settings: Customize colors and styles to match your trading workspace
Automatic Operation: The indicator intelligently manages level transitions
💡 Practical Applications
Identify potential support and resistance areas across multiple timeframes
Establish realistic profit targets based on historical volatility
Plan trade entries and exits around significant time-based levels
Analyze market volatility patterns across different time horizons
Incorporate institutional trading concepts into your analysis
Previous D/W/M HLOCHey traders,
Here's a simple Multi-Timeframe indicator that essentially turns time and price into a box. It'll take the previous high, low, opening price, or closing price from one of the three timeframes of your choice (day, week, or month). For whatever reason I can't get the opening price to function consistently so if you find improvements feel free to let me know, this will help traders who prefer to use opening price over closing price.
Naturally this form of charting is classical and nature and some key figures you could use to study its usage are
- Richard W. Schabacker (1930s)
- Edwards & Magee (1948)
- Peter Brandt
- Stacey Burke (more on the intraday side - typically our preference)
It's usage put plainly:
- Quantifying Accumulation or Distribution
- Revealing Energy Build-Up (Compression)
- Framing Breakouts and False Breakouts
- Structuring Time
- Identifying opportunities to trade a daily, weekly, or monthly range.

Price–Volume Anomaly DetectorDescription
This indicator identifies unusual relationships between price strength and trading volume. By analyzing expected intraday volume behavior and comparing it with current activity, it highlights potential exhaustion, absorption, or expansion events that may signal changing market dynamics.
How It Works
The script profiles average volume by time of day and compares current volume against this adaptive baseline. Combined with normalized price movement (ATR-based), it detects conditions where price and volume diverge:
Exhaustion: Strong price move on low volume (potential fade)
Absorption: Weak price move on high volume (potential reversal)
Expansion: Strong price move on high volume (momentum continuation)
Key Features
Adaptive time-based volume normalization
Configurable sensitivity thresholds
Optional visibility for each anomaly type
Adjustable label transparency and offset
Light Mode support: label text automatically adjusts for dark or light chart backgrounds
Lightweight overlay design
Inputs Overview
Volume Profile Resolution: Defines time bucket size for expected volume
[* ]Lookback Days: Controls how quickly the profile adapts
Price / Volume Thresholds: Tune anomaly sensitivity
Show Expansion / Exhaustion / Absorption: Toggle specific labels
Label Transparency & Offset: Adjust chart visibility
How to Use:
Apply the indicator to any chart or timeframe.
Observe where labels appear:
🔴 Exhaustion: strong price, weak volume
🔵 Absorption: weak price, strong volume
🟢 Expansion: strong price, strong volume
Use these as context clues, not trade signals — combine with broader volume or trend analysis.
How It Helps
Reveals hidden price–volume imbalances
Highlights areas where momentum may be fading or strengthening
Enhances understanding of market behavior beyond raw price action
⚠️Disclaimer:
This script is provided for educational and informational purposes only. It is not financial advice and should not be considered a recommendation to buy, sell, or hold any financial instrument. Trading involves significant risk of loss and is not suitable for every investor. Users should perform their own due diligence and consult with a licensed financial advisor before making any trading decisions. The author does not guarantee any profits or results from using this script, and assumes no liability for any losses incurred. Use this script at your own risk.

Trend Compass (Manual)## Trend Compass (Manual) - A Discretionary Trader's Dashboard
### Summary
Trend Compass is a simple yet powerful dashboard designed for discretionary traders who want a constant, visual reminder of their market analysis directly on their chart. Instead of relying on automated indicators, this tool gives you **full manual control** to define the market state across different timeframes or conditions.
It helps you stay aligned with your higher-level analysis (e.g., HTF bias, current market structure) and avoid making impulsive decisions that go against your plan.
### Key Features
- **Fully Manual Control:** You decide the trend. No lagging indicators, no confusing signals. Just your own analysis, displayed clearly.
- **Multiple Market States:** Define each row as an `Uptrend`, `Downtrend`, `Pullback`, or `Neutral` market.
- **Customizable Rows:** Display up to 8 rows. You can label each one however you like (e.g., "D1", "H4", "Market Structure", "Liquidity Bias").
- **Flexible Panel:** Change all colors, text sizes, and place the panel in any of the 9 positions on your chart.
- **Clean & Minimalist:** Designed to provide essential information at a glance without cluttering your chart.
### How to Use
1. **Add to Chart:** Add the indicator to your chart.
2. **Open Settings:** Go into the indicator settings.
3. **Configure Rows:**
- In the "Rows (Manual Control)" section, set the "Number of rows" you want to display.
- For each row, give it a custom **Label** (e.g., "m15").
- Select its current state from the dropdown menu (`Uptrend`, `Downtrend`, etc.).
- To remove a row, simply set its state to `Hidden`.
4. **Customize Style:**
- In the "Panel & Visual Style" section, adjust colors, text sizes, and the panel's position to match your chart's theme.
This tool is perfect for price action traders, ICT/SMC traders, or anyone who values a clean chart and a disciplined approach to their analysis.

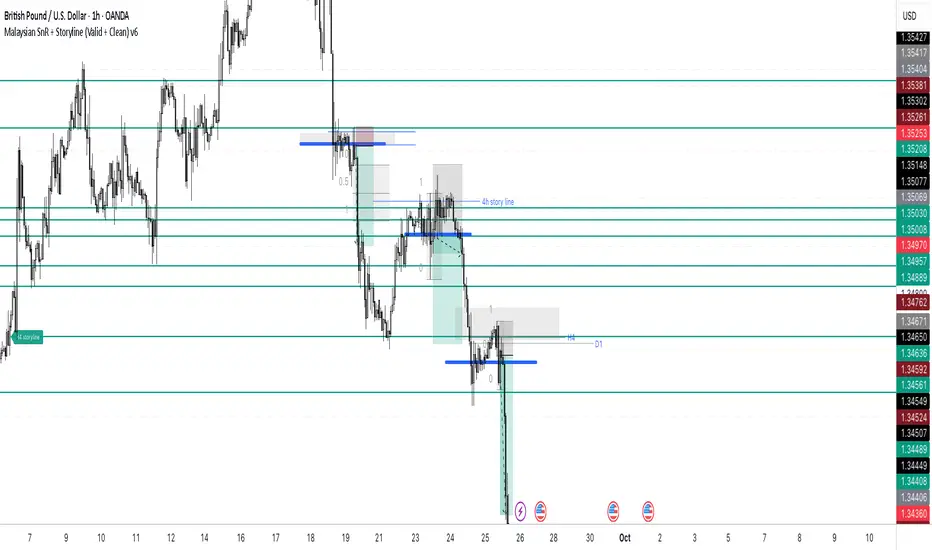
Malaysian SnR + Storyline This indicator combines the Malaysian Support & Resistance (SnR) method with a Multi-Timeframe Storyline view.
🔹 Malaysian SnR (A/V levels)
Plots Support & Resistance using candlestick bodies only (close → open).
“A” shape = Resistance (bullish close → bearish open).
“V” shape = Support (bearish close → bullish open).
Supports Fresh/Unfresh logic with wick-touch validation.
🔹 Storyline (W/D/H4/H1 bias lines)
Weekly = Big map / macro bias.
Daily = Medium trend / retracement.
H4 = Intraday bias confirmation.
H1 = Execution bias (entry filter).
Lines extend forward and only update when a new pivot confirms.
🔹 Extra Features
Alignment Rule: option to hide A/V levels when TF biases don’t align (e.g. W=D=H4=H1).
Story Labels: optional text labels describing each TF storyline.
History filter: show storyline for the last X days only, for cleaner charts.
This script is designed for price action traders who want to combine body-based SnR levels with a clear multi-timeframe bias storyline, making it easier to align intraday execution with higher timeframe context.
Imbalance (FVG)Indicator Description
This script is designed to automatically identify and visualize Fair Value Gaps (FVGs), also known as Imbalances, on your chart. An FVG is a key price action concept that highlights areas where the price moved swiftly, leaving a gap behind. This indicator is simple to use and fully customizable, making it an excellent tool for both novice and experienced traders.
Key Features
Automatic Detection: The indicator scans the market in real-time, automatically drawing FVG zones for both Bullish and Bearish moves.
Mitigation Tracking: When the price returns to an FVG zone, the indicator automatically marks it as "mitigated" (filled) by changing its color and style. This provides a clear signal that the imbalance has been neutralized.
Extend Zones Into the Future: Unmitigated FVG zones are automatically extended into the future, allowing them to be used as potential future support or resistance levels.
Full Customization: The user has complete control over the indicator's appearance. You can change the colors for bullish, bearish, and mitigated zones, as well as toggle their visibility on and off.
Performance Optimization: A built-in limit for the number of drawn objects prevents chart clutter and avoids errors from TradingView's drawing limits, ensuring smooth performance.
How to Use?
FVG zones can be used in various ways, including:
Price Magnets: Markets often tend to revert to "fill" these gaps.
Potential Entry Points: Price entering an FVG zone can present an opportunity to open a position, especially if confirming signals appear.
Support/Resistance Zones: Unfilled gaps can act as strong, dynamic levels of support or resistance.

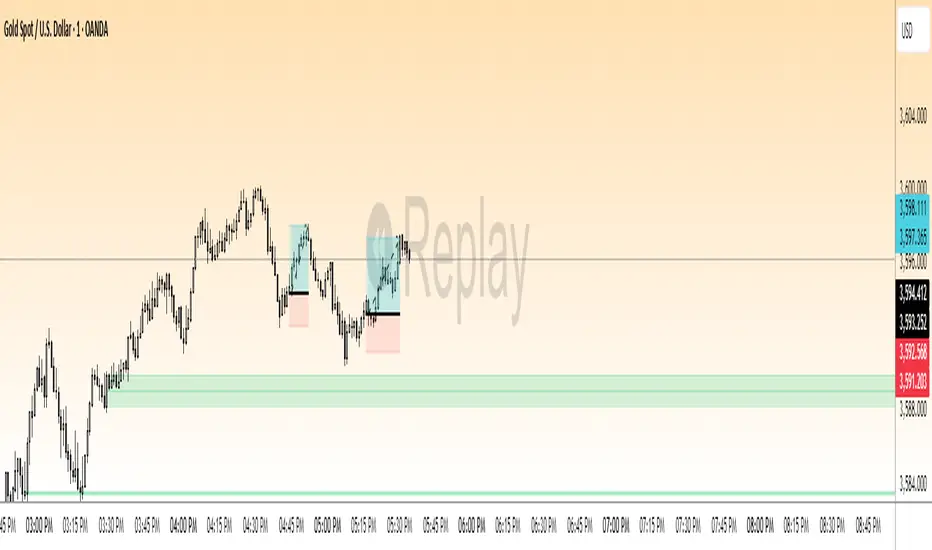
EWC Zone Matrix📌 EWC Precision Blocks
🔎 Overview
EWC Precision Blocks is a professional market analysis tool designed to highlight high-probability trading zones on the chart. Instead of relying on lagging signals, this indicator maps out Alpha Zones (bullish) and Beta Zones (bearish), allowing traders to identify potential market reaction areas with clarity.
The algorithm is built to adapt across Scalp, Swing, and Position trading modes, making it flexible for short-term intraday traders as well as long-term investors.
⚡ Key Features
Multi-Mode Detection – Switch between Scalp, Swing, or Position modes depending on your trading style.
EWC Alpha Zone (Bullish Detection) – Highlights areas where the market may find strong upward momentum.
EWC Beta Zone (Bearish Detection) – Highlights areas where the market may face downward pressure.
Zone Break Tracking – Visualizes when a zone has been invalidated or broken.
Body-Based Detection – Option to base calculations on candle bodies instead of wicks for precision.
Zone Flips – Displays polarity shifts when zones transition from supportive to resistive behavior (and vice versa).
Custom Styling – Full control of zone and break colors for clear chart visualization.
🎯 How to Use
Select Your Mode
Scalp → Designed for fast intraday moves.
Swing → Medium-term setups, ideal for session trading.
Position → Long-term outlook, suitable for investors.
Watch the Alpha Zones
Highlighted bullish areas can serve as potential support or accumulation zones.
Watch the Beta Zones
Highlighted bearish areas may act as resistance or distribution zones.
Monitor Breaks & Flips
Alpha Breaks → Bullish zones failing.
Beta Breaks → Bearish zones failing.
Zone Flips → Polarity changes, often powerful signals.
🛠 Inputs & Customization
EWC Mode → Choose Scalp, Swing, or Position.
Show Last Alpha Zone → Set how many bullish zones to display.
Show Last Beta Zone → Set how many bearish zones to display.
Body-Based Detection → Toggle candle body vs. wick calculation.
EWC Alpha Zone / Beta Zone Styling → Customize zone colors.
Alpha Break / Beta Break Colors → Adjust break visuals.
Show Zone Flips → Enable/disable historical polarity labels.
Status Bar → Display inputs directly in the chart status line.
📈 Best Practices
Works across all timeframes and markets (forex, crypto, indices, stocks).
Combine with your existing strategy for confirmation.
Use in alignment with higher timeframe structure for maximum accuracy.
⚠ Disclaimer
EWC Precision Blocks is a market visualization tool provided for educational purposes only. It does not provide financial advice, signals, or guaranteed results. Always do your own research and manage risk responsibly.
🔹 About EWC
EWC (EastWave Capital) is dedicated to developing professional-grade trading tools and strategies for traders across forex, crypto, commodities, and indices. With over a decade of combined market experience, our mission is to empower traders with precision, clarity, and confidence in their decision-making.
EWC Precision Blocks is one of our flagship tools, reflecting our commitment to innovation, transparency, and trader-focused solutions.
📌 Published by Usama Manzoor — Founder of EastWave Capital (EWC)
1 minute ago
Release Notes
EWC Precision Blocks
The EWC Alpha-Beta Zone Detector is designed for traders who value clarity, precision, and flexibility in their chart analysis.
By mapping out Alpha (strength) and Beta (weakness) zones, this script provides a structured way to understand how price reacts to key levels in the market.
This indicator is built on price action principles and market structure analysis, avoiding clutter and focusing on the essentials traders need. Whether you are scalping on lower timeframes or analyzing swing opportunities, the Alpha-Beta Zone Detector adapts to your style.
🔹 Core Features
Alpha & Beta Zones → Detects bullish and bearish strength zones in real time.
Highlight Last Zone → Focus on the most recent Alpha/Beta zone for clarity.
Zone Flip Detection → Identifies polarity changes when zones shift from support to resistance or vice versa.
Body-Based Detection → Option to base calculations on candle bodies instead of wicks for more accuracy.
Flexible Timeframe Sensitivity → Switch between short, intermediate, and long-term detection modes.
Custom Zone Styling → Adjust colors, opacity, and line thickness for both Alpha and Beta zones.
Break Visualization → Display breaks of Alpha and Beta zones for additional confirmation.
Market Versatility → Works seamlessly on Forex, Crypto, Indices, Commodities, and Stocks.
🔹 Why Traders Use It
Provides a clear visual guide to market decision zones.
Helps traders refine entries, stop-loss placement, and take-profit levels.
Adapts to multiple trading styles → scalpers, intraday traders, and swing traders.
Keeps charts clean and professional without overloading with unnecessary signals.
⚠️ Disclaimer:
This script is created for educational and informational purposes only. It does not provide financial advice. Trading involves risk; always manage your risk responsibly and conduct your own analysis before entering any position.
RB — Rejection Blocks (Price Structure)This indicator detects and visualizes Rejection Blocks (RBs) using pure price action logic.
A bullish RB occurs when a down candle forms a lower low than both its neighbors. A bearish RB occurs when an up candle forms a higher high than both its neighbors.
Validated RBs are displayed as boxes, optional lines, or labels. Blocks are automatically removed when invalidated (price closes through them), keeping the chart uncluttered and focused.
How to use
• Apply on any timeframe, from intraday to higher timeframes.
• Watch how price reacts when revisiting RB zones.
• Treat these zones as contextual areas, not entry signals.
• Combine with your own trading methods for confirmation.
Originality
Unlike generic support/resistance tools, this indicator isolates a specific structural pattern (rejection blocks) and renders it visually on the chart. This selective focus allows traders to study structural reactions with more clarity and precision.
⚠️ Disclaimer: This is not a trading system or a signal provider. It is a visual analysis tool designed for structural and educational purposes.

Smart Structure Breaks & Order BlocksOverview (What it does)
The indicator “Smart Structure Breaks & Order Blocks” detects market structure using swing highs and lows, identifies Break of Structure (BOS) events, and automatically draws order blocks (OBs) from the origin candle. These zones extend to the right and change color/outline when mitigated or invalidated. By formalizing and automating part of discretionary analysis, it provides consistent zone recognition.
Main Components
Swing Detection: ta.pivothigh/ta.pivotlow identify confirmed swing points.
BOS Detection: Determines if the recent swing high/low is broken by close (strict mode) or crossover.
OB Creation: After a BOS, the opposite candle (bearish for bullish BOS, bullish for bearish BOS) is used to generate an order block zone.
Zone Management: Limits the number of zones, extends them to the right, and tracks tagged (mitigated) or invalidated states.
Input Parameters
Left/Right Pivot (default 6/6): Number of bars required on each side to confirm a swing. Higher values = smoother swings.
Max Zones (default 4): Maximum zones stored per direction (bull/bear). Oldest zones are overwritten.
Zone Confirmation Lookback (default 3): Ensures OB origin candle validity by checking recent highs/lows.
Show Swing Points (default ON): Displays triangles on swing highs/lows.
Require close for BOS? (default ON): Strict BOS (close required) vs loose BOS (line crossover).
Use candle body for zones (default OFF): Zones drawn from candle body (ON) or wick (OFF).
Signal Definition & Logic
Swing Updates: Latest confirmed pivots update lastHighLevel / lastLowLevel.
BOS (Break of Structure):
Bullish – close breaks last swing high.
Bearish – close breaks last swing low.
Only one valid BOS per swing (avoids duplicates).
OB Detection:
Bullish BOS → previous bearish candle with lowest low forms the OB.
Bearish BOS → previous bullish candle with highest high forms the OB.
Zones: Bull = green, Bear = red, semi-transparent, extended to the right.
Zone States:
Mitigated: Price touches the zone → border highlighted.
Invalidated:
Bull zone → close below → turns red.
Bear zone → close above → turns green.
Chart Appearance
Swing High: red triangle above bar
Swing Low: green triangle below bar
Bull OB: green zone (border highlighted on touch)
Bear OB: red zone (border highlighted on touch)
Invalid Zones: Bull zones turn reddish, Bear zones turn greenish
Practical Use (Trading Assistance)
Trend Following Entries: Buy pullbacks into green OBs in uptrends, sell rallies into red OBs in downtrends.
Focus on First Touch: First mitigation after BOS often has higher reaction probability.
Confluence: Combine with higher timeframe trend, volume, session levels, key price levels (previous highs/lows, VWAP, etc.).
Stops/Targets:
Bull – stop below zone, partial take profit at swing high or resistance.
Bear – stop above zone, partial take profit at swing low or support.
Parameter Tuning (per market/timeframe)
Pivot (6/6 → 4/4/8/8): Lower for scalping (3–5), medium for day trading (5–8), higher for swing trading (8–14). Increase to reduce noise.
Strict Break: ON to reduce false breaks in ranging markets; OFF for earlier signals.
Body Zones: ON for assets with long wicks, OFF for cleaner OBs in liquid instruments.
Zone Confirmation (default 3): Increase for stricter OB origin, fewer zones.
Max Zones (default 4 → 6–10): Increase for higher volatility, decrease to avoid clutter.
Strengths
Standardizes BOS and OB detection that is usually subjective.
Tracks mitigation and invalidation automatically.
Adaptable: allows body/wick zone switching for different instruments.
Limitations
Pivot-based: Signals appear only after pivots confirm (slight lag).
Zones reflect past balance: Can fail after new events (news, earnings, macro data).
Range-heavy markets: More false BOS; consider stricter settings.
Backtesting: This script is for drawing/visual aid; trading rules must be defined separately.
Workflow Example
Identify higher timeframe trend (4H/Daily).
On lower TF (15–60m), wait for BOS and new OB.
Enter on first mitigation with confirmation candle.
Stop beyond zone; targets based on R multiples and swing points.
FAQ
Q: Why are zones invalidated quickly?
A: Flow reversal after BOS. Adjust pivots higher, enable Strict mode, or switch to Body zones to reduce noise.
Q: What does “tagged” mean?
A: Price touched the zone once = mitigated. Implies some orders in that zone may have been filled.
Q: Body or Wick zones?
A: Wick zones are fine in clean markets. For volatile pairs with long wicks, body zones provide more realistic areas.
Customization Tips (Code perspective)
Zone storage: Currently ring buffer ((idx+1) % zoneLimit). Could prioritize keeping unmitigated zones.
Automated testing: Add strategy.entry/exit for rule-based backtests.
Multi-timeframe: Use request.security() for higher timeframe swings/BOS.
Visualization: Add labels for BOS bars, tag zones with IDs, count touches.
Summary
This indicator formalizes the cycle Swing → BOS → OB creation → Mitigation/Invalidation, providing consistent structure analysis and zone tracking. By tuning sensitivity and strictness, and combining with higher timeframe context, it enhances pullback/continuation trading setups. Always combine with proper risk management.

Recent Range DetectorOverview
The Recent Range Detector is a specialized indicator designed to identify when an asset is currently range-bound, providing traders with clear support and resistance levels for range trading strategies. Unlike traditional indicators that focus on trend detection, this tool specifically answers the question: "Is the price range-bound right now, and what are the exact trading levels?"
Key Features
✅ Smart Range Detection - Uses a multi-factor scoring system to identify legitimate ranges
✅ Dynamic Support/Resistance Levels - Automatically calculates and displays key trading levels
✅ Range Quality Scoring - Provides confidence levels (Strong/Moderate/Weak Range)
✅ Touch Validation - Counts actual price touches to confirm range reliability
✅ Breakout Detection - Alerts when price exits the established range
✅ Visual Clarity - Clean boxes, lines, and labels for easy interpretation
How It Works
The indicator analyses recent price action using three core metrics:
Touch Quality (40%) - How many times price has respected support/resistance levels
Containment Quality (40%) - What percentage of recent bars stayed within the range
Recent Respect (20%) - Whether the latest price action confirms the range
These combine into a Range Score (0-1) that determines range strength and reliability.
Settings & Parameters
Range Lookback Period (Default: 15)
Number of bars to analyse for range detection
Shorter periods = more responsive to recent ranges
Longer periods = more stable, fewer false signals
Range Tolerance (Default: 2.0%)
Tolerance for price touches around exact highs/lows
Lower values = stricter range requirements
Higher values = more flexible range detection
Minimum Touches (Default: 3)
Required number of support/resistance touches for valid range
Higher values = more confirmed ranges, fewer signals
Lower values = more sensitive, earlier detection
Visual Options
Show Range Box: Displays the range boundaries
Show Support/Resistance Lines: Extends levels into the future
Understanding the Output
Range Score (0.000 - 1.000)
0.7+ = Strong Range (Green) - High confidence range trading setup
0.5-0.7 = Moderate Range (Yellow) - Decent range with some caution
0.3-0.5 = Weak Range (Orange) - Low confidence, be careful
<0.3 = Not Ranging - Avoid range trading strategies
Range Status Classifications
Strong Range - Perfect for range trading strategies
Moderate Range - Good range with normal risk
Weak Range - Marginal range, use smaller positions
Not Ranging - Price is trending or too choppy for range trading
Key Metrics in Info Table
Range Size (%) - Size of the range relative to price level
5-15% = Ideal range size for most strategies
<5% = Tight range, lower profit potential
>15% = Wide range, higher profit potential but more risk
Support/Resistance Levels - Exact price levels for entries/exits
Use these as your key trading levels
Support = potential buy zone
Resistance = potential sell zone
Total Touches - Number of times price respected the levels
3-5 touches = Newly formed range
6-10 touches = Well-established range
10+ touches = Very strong, reliable range
Price Position (%) - Current location within the range
0-20% = Near support (potential long opportunity)
80-100% = Near resistance (potential short opportunity)
40-60% = Middle of range (wait for better entry)
Visual Elements
Range Box
Green Box = Strong Range (Score ≥ 0.7)
Yellow Box = Moderate Range (Score 0.5-0.7)
Orange Box = Weak Range (Score 0.3-0.5)
Support/Resistance Lines
- Horizontal lines showing exact trading levels
- Extend into the future for forward guidance
- Colour matches the range strength
Background Colouring
- Subtle background tint during range periods
- Helps quickly identify ranging vs trending markets
Breakout Signals
- 📈 RANGE BREAK UP - Price breaks above resistance
- 📉 RANGE BREAK DOWN - Price breaks below support
- Only appears for confirmed ranges (Score ≥ 0.5)
Trading Applications
Range Trading Strategy
1. Look for Range Score ≥ 0.5
2. Buy near support (Price Position 0-20%)
3. Sell near resistance (Price Position 80-100%)
4. Set stops just outside the range
5. Exit on breakout signals
Breakout Strategy
1. Identify strong ranges (Score ≥ 0.7)
2. Wait for volume-confirmed breakout
3. Enter in breakout direction
4. Use previous resistance as support (or vice versa)
Market Context
- Strong ranges often occur after trending moves
- Use higher timeframes to confirm overall market structure
- Combine with volume analysis for better entries/exits
Best Practices
What to Look For
✅ Range Score ≥ 0.5 for trading consideration
✅ Multiple touches (5+) for confirmation
✅ Clear price rejection at levels
✅ Reasonable range size (5-15% for most assets)
✅ Recent price respect of boundaries
What to Avoid
❌ Trading ranges with Score < 0.3
❌ Very tight ranges (<3% size) - low profit potential
❌ Ranges with only 1-2 touches - not confirmed
❌ Ignoring breakout signals
❌ Trading against the higher timeframe trend
Alerts Available
- Range Detected - New range formation
- Range Break Up - Upward breakout
- Range Break Down - Downward breakout
- Range Ended - Range condition ended
Timeframe Recommendations
- Daily Charts - Best for swing trading ranges
- 4H Charts - Good for intermediate-term ranges
- 1H Charts - Suitable for day trading ranges
- Lower Timeframes - May produce more noise
Conclusion
The Recent Range Detector eliminates guesswork in range identification by providing objective, quantified range analysis. It's particularly valuable for traders who prefer range-bound strategies or need to identify when trending strategies should be avoided.
Remember: No indicator is perfect. Always combine with proper risk management, volume analysis, and broader market context for best results.
Disclaimer
This indicator is for educational purposes only and should not be considered as financial advice. Trading involves risk, and past performance does not guarantee future results. Always conduct your own research and consider your risk tolerance before making any trading decisions.

CHoCH + BOS + LQ Sweep v6.3.8 PRO+The CHoCH + BOS + LQ Sweep PRO indicator is a comprehensive Smart Money Concepts (SMC) tool designed to identify market structure shifts, liquidity sweeps, and key supply-demand zones across multiple timeframes. It helps traders visualize crucial price action patterns like Change of Character (CHoCH), Break of Structure (BOS), and liquidity grabs that often precede significant market reversals or continuations.
This tool is especially suited for traders applying multi-timeframe analysis and liquidity-based trading strategies on Forex, crypto, indices, or commodities.
1. Liquidity Sweeps (LQ Sweeps)
Identifies when price sweeps previous highs/lows (stop hunts/liquidity grabs).
Configurable strength setting to filter minor vs. major sweeps.
Optional stop at wick or stop at close logic for more precise entries.
Old sweeps can be displayed or hidden, with user-defined limits for historical sweeps.
2. Multi-Timeframe (HTF) Sweeps
Displays liquidity sweeps from higher timeframes (M15, H1, H4, D1, W1).
Individual checkboxes allow flexible combinations (e.g., show only H1 & H4 sweeps).
Unique colors for each timeframe to differentiate visually on the chart.
3. Supply/Demand Zones
Automatically plots zones around swing highs and lows.
Zones are dynamically updated and locked once price interacts with them.
Configurable view: Show both bullish/bearish zones or filter for one side only.
Option to display/hide old zones and limit the number of zones shown.
4. Historical Sweep Management
Stores up to 5000 sweeps internally, while adhering to TradingView’s rendering limits (max 500 drawn).
Ensures chart clarity by prioritizing the most recent sweeps.

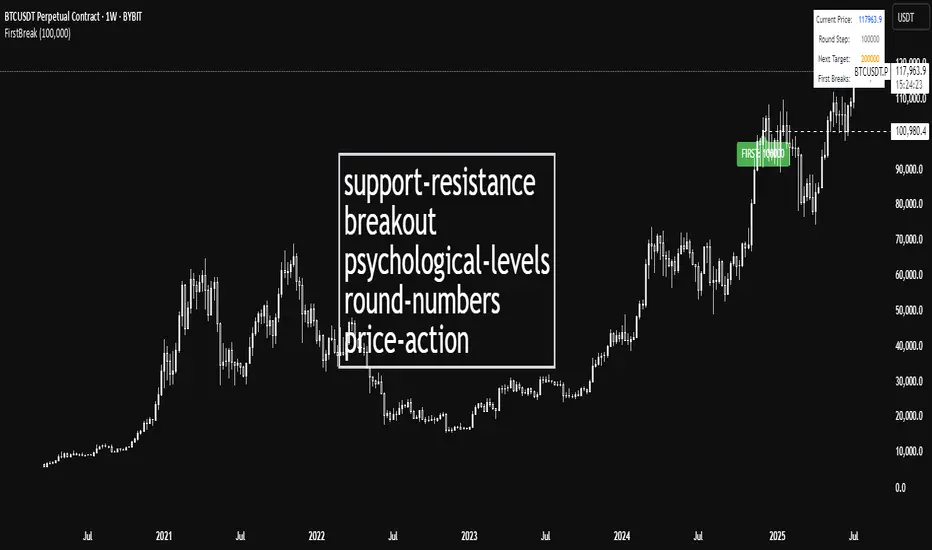
First Round Break TrackerA simple indicator that tracks the first-time breakouts of round number levels (psychological levels) on any chart. Clean interface with minimal configuration needed
First Breakout Only : Marks each round level only once when broken for the first time
Customizable Step Size : Adjustable round number intervals (e.g., 100, 1000, 10000 etc.)
Clean Visual Alerts : Green labels with "FIRST:" prefix appear exactly at breakout moments
Real-time Info Panel : Shows current price, next target level, and total breakouts count
Candle close on high time frameOVERVIEW
This indicator plots persistent closing levels of higher time frame candles (H1, H4, and Daily) on the active intraday chart in real time. Unlike similar tools, it offers granular control over line projection length, fully independent toggles per timeframe, and a built-in mechanism that automatically limits the total number of historical levels to avoid chart clutter and performance issues.
CONCEPTS
Key levels from higher time frames often act as areas where price reacts or consolidates. By projecting each candle's exact closing price forward as a horizontal reference, traders can quickly identify dynamic support and resistance zones relevant to the current price action. This indicator enables seamless multi-timeframe analysis without the need to manually switch chart intervals or re-draw lines.
FEATURES
Independent Time Frame Selection: Enable or disable H1, H4, and Daily levels individually to tailor the analysis.
Custom Extension Length: Each timeframe's closing level can be projected forward for a user-defined number of bars.
Performance Optimization: The script maintains an internal limit (default: 100) on the number of active lines. When this threshold is exceeded, the oldest lines are removed automatically.
Visual Differentiation: Colors for each timeframe are fully customizable, enabling immediate recognition of level origin.
Immediate Update: New levels appear as soon as a higher timeframe candle closes, ensuring real-time reference.
USAGE
From the indicator inputs, select which timeframes you want to track.
Adjust the extension lengths to fit your trading style and time horizon.
Customize the line colors for clarity and personal preference.
Use these projected levels as part of your confluence criteria for entries, exits, or stop placement.
Combine with trend indicators or price action tools to enhance your multi-timeframe strategy.
ORIGINALITY AND ADDED VALUE
While similar scripts exist that plot higher timeframe levels, this implementation differs in:
Its efficient automatic cleanup of old lines to preserve chart performance.
The independent extension and color settings per timeframe.
Immediate reaction to new candle closes without repainting.
Simplicity of use combined with precise customization.
This combination makes it a practical and flexible tool for traders who rely on clear HTF level visualization without manual drawing or the limitations of built-in TradingView tools.
LICENSE
This script is published open-source under the Mozilla Public License 2.0.

TCT - Envelope MatrixTCT - Envelope Matrix
A powerful multi-envelope indicator that creates a comprehensive price channel system with 4 customizable envelopes and multiple intermediate levels for precise price action analysis.
Key Features:
• 4 customizable envelopes with adjustable percentages (0.2%, 0.4%, 0.6%, 0.8% by default)
• Optional EMA or SMA basis calculation
• Color-coded bands for easy visual identification
• Automatic horizontal lines showing current band values
• Midpoint lines between adjacent bands
• Additional 25%, 50%, and 75% levels between each band pair
The indicator provides:
- Clear visual representation of price channels
- Multiple support and resistance levels
- Dynamic price boundaries that adapt to market conditions
- Enhanced precision with intermediate levels between bands
Perfect for:
• Identifying potential support and resistance zones
• Spotting overbought/oversold conditions
• Finding potential reversal points
• Analyzing price volatility and channel width
• Making informed trading decisions based on price position relative to multiple bands
Customization Options:
• Adjustable length for the basis calculation
• Choice between EMA and SMA
• Customizable colors for each envelope
• Flexible percentage settings for each band
• Optional basis line color adjustment
This indicator is particularly useful for traders who want to analyze price action within multiple dynamic channels and identify potential trading opportunities based on price interactions with various support and resistance levels.
Auto Support Resistance Channels [TradingFinder] Top/Down Signal🔵 Introduction
In technical analysis, a price channel is one of the most widely used tools for identifying and tracking price trends. A price channel consists of two parallel trendlines, typically drawn from swing highs (resistance) and swing lows (support). These lines define dynamic support and resistance zones and provide a clear framework for interpreting price fluctuations.
Drawing a channel on a price chart allows the analyst to more precisely identify entry points, exit levels, take-profit zones, and stop-loss areas based on how the price behaves within the boundaries of the channel.
Price channels in technical analysis are generally categorized into three types: upward channels with a positive slope, downward channels with a negative slope, and horizontal (range-bound) channels with near-zero slope. Each type offers unique insights into market behavior depending on the price structure and prevailing trend.
Structurally, channels can be formed using either minor or major pivot points. A major channel typically reflects a stronger, more reliable structure that appears on higher timeframes, whereas a minor channel often captures short-term fluctuations or corrective movements within a larger trend.
For instance, a major downward channel may indicate sustained selling pressure across the market, while a minor upward channel could represent a temporary pullback within a broader bearish trend.
The validity of a price channel depends on several factors, including the number of price touches on the channel lines, the symmetry and parallelism of the trendlines, the duration of price movement within the channel, and price behavior around the median line.
When a price channel is broken, it is generally expected that the price will move in the breakout direction by at least the width of the channel. This makes price channels especially useful in breakout analysis.
In the following sections, we will explore the different types of price channels, how to draw them accurately, the structural differences between minor and major channels, and key trade interpretations when price interacts with channel boundaries.
Up Channel :
Down Channel :
🔵 How to Use
A price channel is a practical tool in technical analysis for identifying areas of support, resistance, trend direction, and potential breakout zones. The structure consists of two parallel trendlines within which price fluctuates.
Traders use the relative position of price within the channel to make informed trading decisions. The two primary strategies include range-based trades (buying low, selling high) and breakout trades (entering when price exits the channel).
🟣 Up Channel
In an upward channel, price moves within a positively sloped range. The lower trendline acts as dynamic support, while the upper trendline serves as dynamic resistance. A common strategy involves buying near the lower support and taking profit or selling near the upper resistance.
If price breaks below the lower trendline with strong volume or a decisive candle, it can signal a potential trend reversal. Channels constructed from major pivots generally reflect dominant uptrends, while those based on minor pivots are often corrective structures within a broader bearish movement.
🟣 Down Channel
In a downward channel, price moves between two negatively sloped lines. The upper trendline functions as resistance, and the lower trendline as support. Ideal entry for short trades occurs near the upper boundary, especially when confirmed by bearish price action or a resistance level.
Exit targets are typically located near the lower support. If the upper boundary is broken to the upside, it may be an early sign of a bullish trend reversal. Like upward channels, a major down channel represents broader selling pressure, while a minor one may indicate a brief retracement in a bullish move.
🟣 Range Channel
A horizontal or range-bound channel is characterized by price oscillating between two nearly flat lines. This type of channel typically appears during sideways markets or periods of consolidation.
Traders often buy near the lower boundary and sell near the upper boundary to take advantage of contained volatility. However, fake breakouts are more frequent in range-bound structures, so it is important to wait for confirmation through candlestick signals and volume. A confirmed breakout beyond the channel boundaries can justify entering a trade in the direction of the breakout.
🔵 Settings
Pivot Period :This parameter defines how sensitive the channel detection is. A higher value causes the algorithm to identify major pivot points, resulting in broader and longer-term channels. Lower values focus on minor pivots and create tighter, short-term channels.
🔔 Alerts
Alert Configuration :
Enable or disable the full alert system
Set a custom alert name
Choose the alert frequency: every time, once per bar, or on bar close
Define the time zone for alert timestamps (e.g., UTC)
Channel Alert Types :
Each channel type (Major/Minor, Internal/External, Up/Down) supports two alert types :
Break Alert : Triggered when price breaks above or below the channel boundaries
React Alert : Triggered when price touches and reacts (bounces) off the channel boundary
🎨 Display Settings
For each of the eight channel types, you can customize:
Visibility : show or hide the channel
Auto-delete previous channels when new ones are drawn
Style : line color, thickness, type (solid, dashed, dotted), extension (right only, both sides)
🔵 Conclusion
The price channel is a foundational structure in technical analysis that enables traders to analyze price movement, identify dynamic support and resistance zones, and locate potential entry and exit points with greater precision.
When constructed properly using minor or major pivots, a price channel offers a consistent and intuitive framework for interpreting market behavior—often simpler and more visually clear than many other technical tools.
Understanding the differences between upward, downward, and range-bound channels—as well as recognizing the distinctions between minor and major structures—is critical for selecting the right trading strategy. Upward channels tend to generate buying opportunities, downward channels prioritize short setups, and horizontal channels provide setups for both mean-reversion and breakout trades.
Ultimately, the reliability of a price channel depends on various factors such as the number of touchpoints, the duration of the channel, the parallelism of the lines, and how the price reacts to the median line.
By taking these factors into account, an experienced analyst can effectively use price channels as a powerful tool for trend forecasting and precise trade execution. Although conceptually simple, successful application of price channels requires practice, pattern recognition, and the ability to filter out market noise.

MTF Fractals [RunRox]🔽 MTF Fractals is a powerful indicator designed to visualize fractals from multiple timeframes directly on your chart, highlight liquidity sweeps at these fractal levels, and provide several additional features we’ll cover in detail below.
We created this indicator because we couldn’t find a suitable tool that met our specific needs on TradingView. Therefore, we decided to develop a valuable indicator for the entire TradingView community, combining simplicity and versatility.
⁉️ WHAT IS A FRACTALS?
In trading, a fractal is a technical analysis pattern composed of five consecutive candles, typically highlighting local market turning points. Specifically, a fractal high is formed when a candle’s high is higher than the highs of the two candles on either side, whereas a fractal low occurs when a candle’s low is lower than the lows of the two adjacent candles on both sides.
Traders use fractals as reference points for identifying significant support and resistance levels, potential reversal areas, and liquidity zones within price action analysis. Below is a screenshot illustrating clearly formed fractals on the chart.
📙 FRACTAL FORMATION
Here’s how fractals form depending on your chosen setting (3, 5, 7, or 9):
▶️ 3-bar fractal – forms when the central candle is higher (for highs) or lower (for lows) than one candle on each side.
▶️ 5-bar fractal – forms when the central candle is higher or lower than two candles on both sides.
▶️ 7-bar fractal – forms when the central candle is higher or lower compared to the three candles on each side.
▶️ 9-bar fractal – forms similarly but requires four candles on each side, making the fractal significantly more reliable and robust.
A higher number of bars ensures stronger fractal levels, highlighting more significant potential reversal points on the chart.
Now that we’ve covered the theory behind fractal formation, let’s explore the indicator’s functionality in more detail.
Below, I’ll explain each feature clearly and illustrate how you can effectively utilize this indicator in your trading.
🕐 MULTI-TIMEFRAME FRACTALS
We realized that displaying fractals only from the current timeframe isn’t always convenient, so we’ve introduced Multi-Timeframe Fractals into this indicator.
Now you can easily display fractals from higher timeframes directly on your current chart, providing you with broader market context and clearer trading signals.
Fractals from Current Timeframe – Fractals identified directly on the chart’s current timeframe.
Fractals from Higher Timeframes – Fractals sourced from higher timeframes and displayed clearly on your current chart for enhanced market perspective.
📈 FRACTAL LINES
Since fractals represent areas of high liquidity, we’ve added an option to extend fractal levels horizontally as Fractal Lines across your chart.
This feature allows you to clearly visualize critical liquidity areas from higher timeframes, directly on your current timeframe chart, as demonstrated in the screenshot below.
With this approach, you can clearly visualize significant fractal levels from higher timeframes directly on your current chart - for example, projecting fractals from the 1-hour (1H) timeframe onto a 3-minute (3m) chart. ✅ This helps you easily identify critical liquidity areas and potential reversal zones without the need to switch between multiple timeframes.
💰 LIQUDITY SWEEP (LIQUDITY GRAB)
To enhance your trading experience, we’ve introduced a feature that clearly identifies liquidity sweeps of fractal levels.
A Liquidity Sweep occurs when a candle closes beyond a fractal line, leaving a wick that pierces through it, signaling that liquidity has been collected at this level.
Below, you’ll find two examples illustrating this functionality:
▶️ Fractal lines from the current timeframe
▶️ Fractal lines projected from higher timeframes
The first example illustrates liquidity being swept from fractals on the current timeframe .
Here, the candle clearly closes beyond the fractal line, leaving a wick through it. This indicates a liquidity sweep at the fractal level, visually highlighting a potential reversal or continuation opportunity directly on your chart.
In the second example, fractals from the higher timeframe are projected onto your current chart.
When a candle on your current timeframe closes beyond an HTF fractal line - leaving a wick through this level - the indicator highlights it clearly. This signals to traders a potential reversal zone, indicating that liquidity has been swept, and price may reverse or significantly react from this area.
You can also enable the display of additional labels on the chart. These labels clearly mark liquidity sweeps at fractal levels, making it easier to visually identify potential reversal points directly on your chart.
⚙️ SETTINGS
Below are the indicator settings with detailed explanations for each parameter.
🔷 Bars in Fractal – Number of candles to the right and left required to form a fractal.
🔷 Fractal Timeframe – Select the timeframe from which you want to display fractals on the current chart.
🔷 Max Age, bars – Number of bars during which the fractal will remain active.
🔷 Show Fractal Line – Display or hide fractal lines.
🔷 Line Style – Choose the style of the line displayed on the chart.
🔷 Line Width – Thickness of the fractal line.
🔷 High Fractal – Style and color of bearish fractals.
🔷 Low Fractal – Style and color of bullish fractals.
🔷 Fractal Label Size – Select the size of fractal labels.
🔷 Show Sweep Labels – Option to display labels when a liquidity sweep occurs.
🔷 Label Color – Color and transparency of the area marked on the chart during a sweep.
🔷 Shade Sweep Area – Show or hide the sweep area shading.
🔷 Area Color – Color and transparency settings for the sweep area.
🔶 We’d love to hear your feedback and any suggestions for additional features you’d like to see in this indicator. We’ll be happy to consider your ideas and continue improving the indicator!

1H/3m Concept [RunRox]🕘 1H/3m Concept is a versatile trading methodology based on liquidity sweeps from fractal points identified on higher timeframes, followed by price reversals at these key moments.
Below, I will explain this concept in detail and provide clear examples demonstrating its practical application.
⁉️ WHAT IS A FRACTALS?
In trading, a fractal is a technical analysis pattern composed of five consecutive candles, typically highlighting local market turning points. Specifically, a fractal high is formed when a candle’s high is higher than the highs of the two candles on either side, whereas a fractal low occurs when a candle’s low is lower than the lows of the two adjacent candles on both sides.
Traders use fractals as reference points for identifying significant support and resistance levels, potential reversal areas, and liquidity zones within price action analysis. Below is a screenshot illustrating clearly formed fractals on the chart.
📌 ABOUT THE CONCEPT
The 1H/3m Concept involves marking Higher Timeframe (HTF) fractals directly onto a Lower Timeframe (LTF) chart. When a liquidity sweep occurs at an HTF fractal level, we remain on the same LTF chart (since all HTF fractals are already plotted on this lower timeframe) and wait for a clear Market Structure Shift (MSS) to identify our potential entry point.
Below is a schematic illustration clearly demonstrating how this concept works in practice.
Below is another 💡 real-chart example , showing liquidity in the form of a 1H fractal, swept by a rapid impulse move. Immediately afterward, a clear Market Structure Shift (MSS) occurs, signaling a potential entry point into the trade.
Another example is shown below, where we see our hourly fractal, from which price clearly reacts, providing an opportunity to search for an entry point.
As illustrated on the chart, the fractal levels from the higher timeframe are clearly displayed, but we’re working directly on the 5-minute chart. This allows us to remain on one timeframe without needing to switch back and forth between charts to spot such trading setups.
🔍 MTF FRACTALS
This concept can be applied across various HTF-LTF timeframe combinations. Although our examples illustrate 1H fractals used on a 5-minute chart, you can effectively utilize many other timeframe combinations, such as:
30m HTF fractals on 1m chart
1H HTF fractals on 3m chart
4H HTF fractals on 15m chart
1D HTF fractals on 1H chart
The key idea behind this concept is always the same: identify liquidity at fractal levels on the higher timeframe (HTF), then wait for a clear Market Structure Shift (MSS) on the lower timeframe (LTF) to enter trades.
⚙️ SETTINGS
🔷 Trade Direction – Select the preferred trading direction (Long, Short, or Both).
🔷 HTF – Choose the higher timeframe from which fractals will be displayed on the current chart.
🔷 HTF Period – Number of candles required on both sides of a fractal candle (before and after) to confirm fractal formation on the HTF.
🔷 Current TF Period – Sensitivity to the impulse that sweeps liquidity, used for identifying and forming the MSS line.
🔷 Show HTF – Enable or disable displaying HTF fractal lines on your chart. You can also customize line style and color.
🔷 Max Age (Bars) – Number of recent bars within which fractals from the selected HTF will be displayed.
🔷 Show Entry – Enable or disable displaying the MSS line on the chart.
🔷 Enable Alert – Activates TradingView alerts whenever the MSS line is crossed.
You can also enable 🔔 alerts, which notify you whenever price crosses the MSS line. This significantly simplifies the process of identifying these setups on your charts. Simply configure your preferred timeframes and wait for notifications when the MSS line is crossed.
🔶 We greatly appreciate your feedback and suggestions for improving the indicator!

Liquitive Buy/Sell Dollar AveragerLiquitive Buy/Sell Dollar Averager Indicator
The "Liquitive Buy/Sell Dollar Averager" is a versatile trading tool designed for intraday and multi-timeframe analysis, combining advanced range-bound calculations, RSI normalization, volume spikes, and candle pattern recognition to identify optimal buy and sell conditions. This indicator is particularly suitable for traders employing strategies that focus on dollar-cost averaging, position scaling, and systematic buy/sell decision-making.
Key Features:
Adaptive RSI-Based Levels:
Dynamically calculates inner bounds (IB) and outer bounds (OB) using RSI and price ranges, helping to identify overbought and oversold conditions relative to the price action.
Normalizes RSI values to the price range for seamless visualization overlaid on the chart.
Volume and Candle Analysis:
Detects significant volume spikes relative to a moving average, signaling increased market activity.
Identifies spiking green/red candles to capture momentum-driven price movements.
Dynamic Support and Resistance:
Calculates and plots support and resistance levels based on recent swing highs and lows.
Median and boundary lines help visualize key price levels for decision-making.
Profitability Check:
Buy and Sell Signals:
Checks profitability thresholds based on percentage gains/losses.
Incorporates logic for "time to buy" and "time to sell" using target profit margins.
Implements average move percentage to define realistic thresholds for buy/sell actions.
Time-Based Trading Restrictions:
Configures trading logic to disallow trades after a specific time (e.g., 3:40 PM for intraday sessions).
Ensures logical entry and exit decisions are only made within active trading hours.
Color-Coded Visualization:
Background colors dynamically shift between green (bullish), red (bearish), and neutral, depending on RSI and price position relative to the inner bounds.
Opacity of the background adjusts based on normalized RSI differences to provide a visual cue of market strength.
Customizable Parameters:
Allows user input for key settings like lookback periods, RSI length, percent ranges, volume thresholds, and transparency levels, enabling flexible configuration tailored to individual strategies.
Actionable Alerts and Signals:
Plots "Open Position", "Add to Position", and "Close Position" markers directly on the chart, making it easy to follow systematic trading rules.
How It Works:
Buy Signals:
Triggered when price conditions, volume spikes, and RSI-based thresholds align with profitability metrics.
Designed for dollar-cost averaging, identifying opportunities to add to long positions or open new positions.
Sell Signals:
Evaluates profitability conditions to identify when to close or scale out of positions.
Incorporates real-time evaluation of market momentum and profitability.
