Simple RangeThe daily price range is a good proxy to judge an instrument’s volatility. I have combined multiple concepts in this indicator to display information regarding the daily price range & its volatility.
A trading period's range is simply the difference between its high and the low. This script shows the daily high-to-low range of the price as a column chart. It has 3 main components:
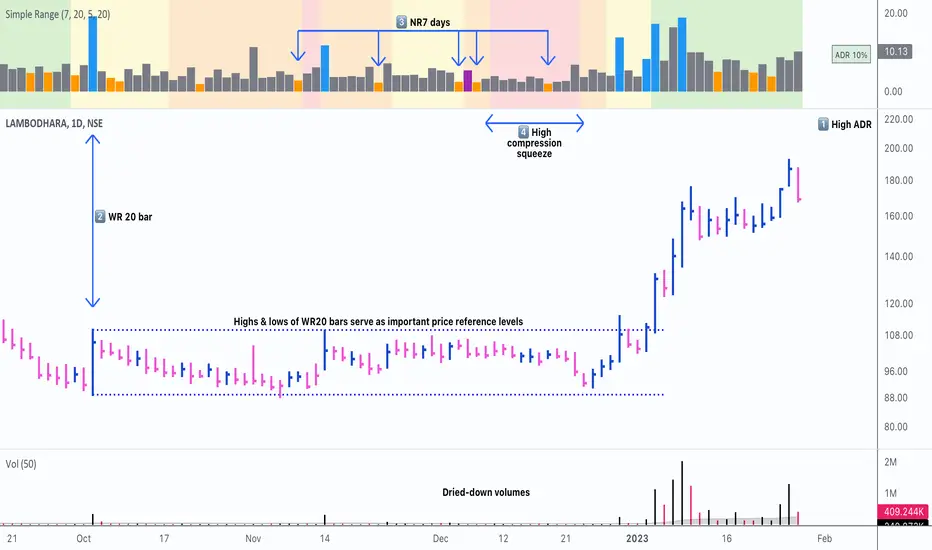
1. Narrow-range days (NR7) & Wide-range Days (WR20) - as plot columns
Original concept from Thomas Bulkowski
Modified from "NR4 & NR7 Indicator" script by theapextrader7
Modified from "WR - BC Identifier" script by wrpteam2020
Narrow range days mark price contractions that often precede price expansions. This script uses NR7 (narrow range 7) as a narrow-range day. This value can be changed by the user if, instead of an NR7, he or she wishes to use NR4 or NR21, or any other interval of his or her choice. NR7 is an indecisive trading day in which the range is narrower than any of the previous six days (a total of 7 days). This is a popular concept given by Thomas Bulkowski. A breakout is said to occur when price closes above the top or below the bottom of the NR7. Upside breakout of an NR 7 candle with high volumes indicates bullishness.
Similarly, highs & lows of wide-range bars (on big volumes) are also significant reference levels for price. Wide-range candle are identified by size of the body candle (open - close). The script compares the size of previous 20 candles to identify WR20 candles. This value can also be changed by the user.
The script shows NR7 & WR20 as orange & blue bars, respectively.
The user can also turn on the option to identify a big high-to-low range candle greater than a pre-defined threshold (default is 5%). These show up as green or red bars.
2. TTM Squeeze - as background
Original concept from John Carter's book "Mastering the Trade"
Based on "Squeeze Momentum Indicator" script by LazyBear
John Carter’s TTM Squeeze indicator looks at the relationship between Bollinger Bands and Keltner's Channels to help identify period of volatility contractions. Bollinger Bands being completely enclosed within the Keltner Channels is indicative of a very low volatility. This is a state of volatility contraction known as squeeze. Using different ATR lengths (1.0, 1.5 and 2.0) for Keltner Channels, we can differentiate between levels of squeeze (High, Mid & Low compression, respectively). Greater the compression, higher the potential for explosive moves.
In the script, the High, Mid & Low compression squeezes are depicted via the background color being red, orange, or yellow, respectively.
3. Average Daily Range - as table
Original idea by alpine_trader
Modified from "ADR% - Average Daily Range % by MikeC" script by TheScrutiniser
Average Day Range (ADR) tells how much the price moves between the high and low on a given day. This is the day Range, which is then averaged to create ADR. The script uses an average of the last 20 days to calculate the ADR. Unlike ATR (Average True Range), this excludes Gaps.
The script displays the ADR as a % value in a table.
If you want to find stocks that move a lot on an average on most days, then look for stocks that have ADR% of 5% or more.
If you prefer lower volatility stocks, focus on stocks with lower ADR% values, such as 2% or less.
How it comes together
For a bullish "momentum burst", or a velocity trade:
Select stocks with Average Day Range % (ADR) greater than 5
Identify significant reference price levels via highs & lows of WR20 bars (on big volumes)
Wait for a decent mid-to-high compression squeeze
Look for clusters of NR7 candles in the consolidation
Any breakout from this consolidation should be accompanied by more than average (preferably pocket pivot) volumes
ADR
ATR PivotsThe "ATR Pivots" script is a technical analysis tool designed to help traders identify key levels of support and resistance on a chart. The indicator uses various metrics such as the Average True Range (ATR), Daily True Range ( DTR ), Daily True Range Percentage (DTR%), Average Daily Range (ADR), Previous Day High ( PDH ), and Previous Day Low ( PDL ) to provide a comprehensive picture of the volatility and movement of a security. The script also includes an EMA cloud and 200 EMA for trend identification and a 1-minute ATR scalping strategy for traders to make informed trading decisions.
ATR Detail:-
The ATR is a measure of the volatility of a security over a given period of time. It is calculated by taking the average of the true range (the difference between the high and low of a security) over a set number of periods. The user can input the number of periods (ATR length) to be used for the ATR calculation. The script also allows the user to choose whether to use the current close or not for the calculation. The script calculates various levels of support and resistance based on the relationship between the security's range ( high-low ) and the ATR. The levels are calculated by multiplying the ATR by different Fibonacci ratios (0.236, 0.382, 0.5, 0.618, 0.786, 1.000) and then adding or subtracting the result from the previous close. The script plots these levels on the chart, with the -100 level being the most significant level. The user also has an option to choose whether to plot all Fibonacci levels or not.
DTR and DTR% Detail:-
The Daily True Range Percentage (DTR%) is a metric that measures the daily volatility of a security as a percentage of its previous close. It is calculated by dividing the Daily True Range ( DTR ) by the previous close. DTR is the range between the current period's high and low and gives a measure of the volatility of the security on a daily basis. DTR% can be used as an indicator of the percentage of movement of the security on a daily basis. In this script, DTR% is used in combination with other metrics such as the Average True Range (ATR) and Fibonacci ratios to calculate key levels of support and resistance for the security. The idea behind using DTR% is that it can help traders to better understand the daily volatility of the security and make more informed trading decisions.
For example, if a security has a DTR% of 2%, it suggests that the security has a relatively low level of volatility and is less likely to experience significant price movements on a daily basis. On the other hand, if a security has a DTR% of 10%, it suggests that the security has a relatively high level of volatility and is more likely to experience significant price movements on a daily basis.
ADR:-
The script then calculates the ADR (Average Daily Range) which is the average of the daily range of the security, using the formula (Period High - Period Low) / ATR Length. This gives a measure of the average volatility of the security on a daily basis, which can be useful for determining potential levels of support and resistance .
PDH /PDL:-
The script also calculates PDH (Previous Day High) and PDL (Previous Day Low) which are the High and low of the previous day of the security. This gives a measure of the previous day's volatility and movement, which can be useful for determining potential levels of support and resistance .
EMA Cloud and 200 EMA Detail:-
The EMA cloud is a technical analysis tool that helps traders identify the trend of the market by comparing two different exponential moving averages (EMAs) of different lengths. The cloud is created by plotting the fast EMA and the slow EMA on the chart and filling the space between them. The user can input the length of the fast and slow EMA , and the script will calculate and plot these EMAs on the chart. The space between the two EMAs is then filled with a color that represents the trend, with green indicating a bullish trend and red indicating a bearish trend . Additionally, the script also plots a 200 EMA , which is a commonly used long-term trend indicator. When the fast EMA is above the slow EMA and the 200 EMA , it is considered a bullish signal, indicating an uptrend. When the fast EMA is below the slow EMA and the 200 EMA , it is considered a bearish signal, indicating a downtrend. The EMA cloud and 200 EMA can be used together to help traders identify the overall trend of the market and make more informed trading decisions.
1 Minute ATR Scalping Strategy:-
The script also includes a 1-minute ATR scalping strategy that can be used by traders looking for quick profits in the market. The strategy involves using the ATR levels calculated by the script as well as the EMA cloud and 200 EMA to identify potential buy and sell opportunities. For example, if the 1-minute ATR is above 11 in NIFTY and the EMA cloud is bullish , the strategy suggests buying the security. Similarly, if the 1-minute ATR is above 30 in BANKNIFTY and the EMA cloud is bullish , the strategy suggests buying the security.
Inside Candle:-
The Inside Candle is a price action pattern that occurs when the current candle's high and low are entirely within the range of the previous candle's high and low. This pattern indicates indecision or consolidation in the market and can be a potential sign of a trend reversal. When used in the 15-minute chart, traders can look for Inside Candle patterns that occur at key levels of support or resistance. If the Inside Candle pattern occurs at a key level and the price subsequently breaks out of the range of the Inside Candle, it can be a signal to enter a trade in the direction of the breakout. Traders can also use the Inside Candle pattern to trade in a tight range, or to reduce their exposure to a current trend.
Risk Management:-
As with any trading strategy, it is important to practice proper risk management when using the ATR Pivots script and the 1-minute ATR scalping strategy. This may include setting stop-loss orders, using appropriate position sizing, and diversifying your portfolio. It is also important to note that past performance is not indicative of future results and that the script and strategy provided are for educational purposes only.
In conclusion, the "ATR Pivots" script is a powerful tool that can help traders identify key levels of support and resistance , as well as trend direction. The additional metrics such as DTR , DTR%, ADR, PDH , and PDL provide a more comprehensive picture of the volatility and movement of the security, making it easier for traders to make better trading decisions. The inclusion of the EMA cloud and 200 EMA for trend identification, and the 1-minute ATR scalping strategy for quick profits can further enhance a trader's decision-making process. However, it is important to practice proper risk management and understand that past performance is not indicative of future results.
Special thanks to satymahajan for the idea of clubbing Average True Range with Fibonacci levels.

Average Range @coldbrewroshTaking the average daily range from low to high or high to low isn't the "best" way to get an idea of how much to set targets. So, I made this indicator to make the system better.
This indicator calculates the daily range from Open to High on Bullish Days & Open to Low on Bearish Days .
Nobody can catch the absolute low of the day on bullish days and get out at the high but one can enter at a reasonable price around the open ( 17:00 EST ) .
To complement the Average Range, another table shows the movement in the opposite direction.
For Instance: On Bullish Days how much it moved from Open to Low so that we have an idea of where to put the stop loss and vice versa. The time ranges calculated are the last 5 days, last 1 month, last 3 months & last 1 year.
Note #1: Even though the date range is predefined, it has a different meaning. For Instance: date range of last 5 days means "calculation of the range of last 5 bullish daily candles & not last 5 days" .
Note #2: Exclusive to Forex at the time of posting this.

Sw1tchFX - Average Daily RangeDESCRIPTION AND OVERVIEW
The Average Daily Range is a measure of volatility (typically across 5 days for the FX markets). I originally saw this being used in a trading system called ANTSSYS by Daryll Guppy and some other developers. I couldn't find it anywhere so I decided to build it from scratch.
What this does is allow you to measure volatility across various FX assets (I will apply other asset classes in the future that this is applicable to i.e. Crypto, Commodities, Blue Chip Stocks), and set realistic targets based off that volatility. Overall, this makes much more sense to me in the FX markets rather than support and resistance lines because it's based off the actual movement of the asset class. Market research shows that an asset class has a 80-85% chance to reach 75% of it's Average Daily Range (ADR).
Let's take a look at the daily ADR on the GBPNZD 15m chart. Notice how the values of the ADR act as real support and resistance based off the volatility of the asset. In this case, price did not quite reach the 75% ADR target.
Let's take a look at another example on EURNZD 15m chart. In this case, price hit the 75% target.
It's important to note that these levels do not bound the price. The probability that price exceeds it's 75% ADR is fairly low, but not impossible. Especially during important news events. Let's look at the recent USDCHF 15m chart for example.
Additionally, you can use these values to measure longer term movements (Weekly, and Monthly)
Here is a weekly view:
And a monthly view:
HOW I USE THIS
I use this in conjunction with some other indicators I've developed. Typically, I use range bars since I only care about price, not time. Additionally, averages are smoother when time is not taken into account and only price.
HOW THE CANDLE OPEN AND CLOSE IS CALCULATED
This is done based off of your own specific time zone and from the daily candle. So for me on PST, the daily candle will close at 1400. Once closed, a new ADR value is automatically calculated and added to the chart. There is an option to show past ADR values if you would like to see them or conduct additional research.

Average Daily Range Lines + VWAP by TenozenOANDA:EURUSD
Hello! I created an indicator called ADRL (Average Daily Range Lines). This is my first original work, and I hope it's helpful to you guys.
1. Let me explain a bit of how it works...
So first of I need the ADR value, as by default length I use 19 for it. I want this indicator to calculate every start of the new day and break if another new day starts, so if the target level isn't reached, then the value would start to go back to 0 and get the new target level of the day. The target level is based on the first ADR multiplied by how much "percent" we want for the target level to hit, based on the first ADR value of the day. When the new day starts, the algo would start to add up the ADR value. If the added ADR hits the target level, it starts to plot a line by the candlestick by its high, low, and mid-level; it would create a new line if there is a new target being hit. So that's it.
About the VWAP, I took Tradingview's VWAP. I added the anchored part so I can plot a line if there is a new target level being hit. I hope that's okay.
2. How to use it...
- Using this indicator is pretty easy. When a new box is being plotted, that means that's the time when you should trade, as the box is still fresh. The VWAP helps if the market is trending or not.
- You can treat this indicator just like an S&R, as the price tends to respect the box. So best to use it as a pullback trade.
- We can assume if the price above the box, is a buy; vice versa.
3. Best Market to use...
- I suggest a trade in a nonvolatile market. The more volatile the market is, the harder the box is to be respected by the price. But if you really want to trade in that market, I suggest adjusting the inputs by how the box is being respected.
4. Suggestions...
- Use this indicator in 5 minutes chart if you day trade.
- Try using 30 minutes and setting the percent input from 100 to 80 and changing the ADR length from 19 to 14, this is much more suitable if you tend to hold trades.

Average Daily Range (ADR) (Multi Timeframe, Multi Period)Average Daily Range (ADR)
(Multi Timeframe, Multi Period, Extended Levels)
Tips
• Narrow Zones are an indication of breakouts. It can be a very tight range as well.
• Wider Zones can be Sideways or Volatile.
What is this Indicator?
• This is Average Daily Range (ADR) Zones or Pivots.
• This have Multi Timeframe, Multi Period (Up to 3 Levels) and Extended Target Levels.
Advantages of this Indicator
• This is a Leading indicator, not Dynamic or Repaint.
• Helps to identify the reversal points.
• The levels are more accurate and not like the old formulas.
• Can practically follow the Buy Low and Sell High principle.
• Helps to keep minimum Stop Loss.
Who to use?
• Highly beneficial for Day Traders
• It can be used for Swing and Positions as well.
What timeframe to use?
• Any timeframe.
When to use?
• Any market conditions.
How to use?
Entry
• Long entry when the Price reach at or closer to the Green Support zone.
• Long entry when the Price retrace to the Red Resistance zone.
• Short entry when the Price reach at or closer to the Red Resistance zone.
• Short entry when the Price retrace to the Green Support zone.
• Long or Short at the Pivot line.
Exit
• Use past ADR levels as targets.
• Or use the Target levels in the indicator for breakouts.
• Use the Pivot line as target.
• Use Support or Resistance Zones as targets in reversal method.
What are the Lines?
Gray Line:
• It the day Open or can be considered as Pivot.
Red & Green ADR Zones:
• Red Zone is Resistance.
• Green Zone is Support.
• Mostly price can reverse from this Zones.
• Multiple Red and Green Lines forms a Zone.
• These lines are average levels of past days which helps to figure out the maximum and minimum price range that can be moved in that day.
• The default number of days are 5, 7 and 14. This can be customized.
Red & Green Target Lines:
• These are Target levels.
What are the Labels?
• First Number: Price of that level.
• Numbers in (): Percentage change and Change of price from LTP (Last Traded Price) to that Level.
General Tips
• It is good if Stock trend is same as that of the Index trend.
• Lots of indicators creates lots of confusion.
• Keep the chart simple and clean.
• Buy Low and Sell High.
• Master averages or 50%.

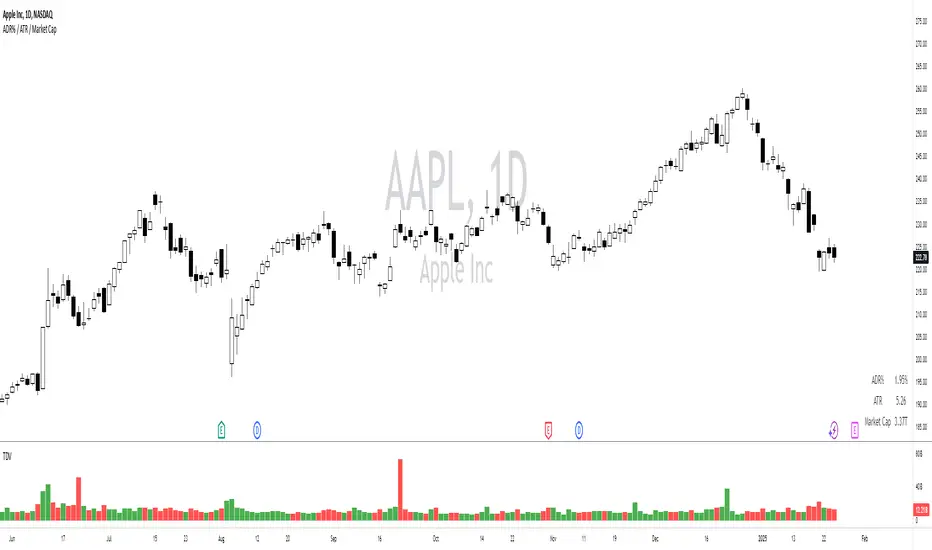
ADR% / ATR / Market CapDisplays the following values in a table in the upper right corner of the chart:
ADR%: Average daily range (in percent).
ATR: Average true range (hidden by default).
Market Cap: Total value of all a company's shares of stock.
All values are calculated based on daily bars, no matter what time frame you are currently viewing. Doesn't work for time frames >1D, which is why the table is not shown on weekly/monthly charts.
Credit to MikeC / TheScrutiniser and GlinckEastwoot for ADR% formula, and ArmerSchlucker for the original script which includes LoD Dist . instead of Market Cap.
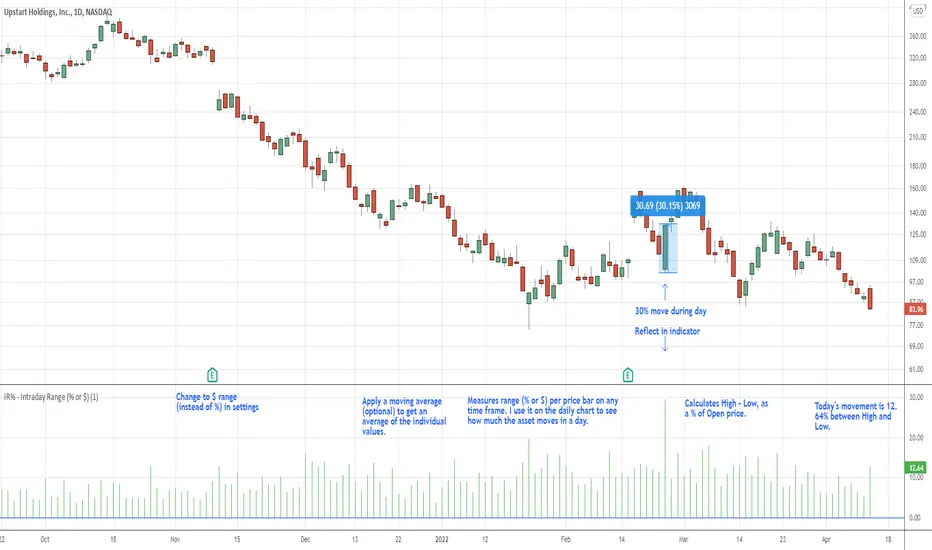
IR% - Intraday Range (% or $)Shows the percentage difference between the High and Low of the price bar expressed as a percent of the Open of that bar. In the settings, you can change to Price Change instead of percent change. This will show the price change between the High and Low for each price bar.
It can be used on any time frame.
I use it on the daily chart . I note the daily figure, and that lets me know how far the price tends to move during a typical day (no gaps included).
If using on another time frame other than the daily, then it is an intrabar calculation, not intraday.
Apply a moving average to it to see the average intraday movement after the open when using a daily chart .
The IR% of a 1-minute chart tells you the price range of that one-minute price bar, and a weekly chart will show the price range of each weekly price bar.
It only measures high to low versus the candle's open price. It does not include gaps between candles, which makes it different than the ATR. ATR is more useful for swing trading, where the trader may be holding through gaps in price, and thus wants to factor them in.
The IR% is useful for day traders because it shows how much a stock tends to move during the day (intraday range), when using a daily chart . ATR is not as effective for this because it includes gaps, which day traders can't generally capitalize on.
If the IR% is fluctuating between 5% and 10% over the last 50 days or so (on the daily chart ), day traders know that AFTER the open, the price is likely to move 5% to 10% from high point to low point. This can help with establishing profit targets, seeking out stocks that tend to move a lot within the day, or avoid these types of stocks if they are undesirable to you. Seek out low IR% stocks if you prefer lower movement during your selected time frame.
A stock may have an ATR% of 5% but ATR doesn't tell us if that movement occurred after the open or includes a gap. Some stocks are prone to gaps. They may gap 4% most days, and then only move 1% during the day. This will still be a 5% ATR%, but most of that movement ISN'T capturable each day. The IR% for this stock would only be 1%, not 5% like the ATR suggests.
I developed this because I like day trading volatile stocks, and I wanted a measure that ONLY includes movement during the day, and doesn't include price gaps in the calculation. Because as a day trader, gaps don't matter to me. I can only make money on what happens during the day, after the open.
It is similar to another indicator called Average Day Range (ADR). Although most ADR calculations are already calculated as an average (so I don't see each individual value) or plots things on the chart. This may be useful for some people, but I wanted to see the data on each price bar, have the option to add a moving average or not, and not have anything plotted on the price chart. It also nice to be able to flip from % to $ dollar movement if desired.
ADR in 0.5 / 1 / 3 / 5top of the morning!
This indicator is a tiny bit different then the previous one i published.
As per my little study into the ATR, i have decided to remove it out of my indicator and instead put in a half an ADR in dollar vallue.
For me, i can use this value to check at what level i would like my stop. The next evolvement of this indicator might be a total new one since i'd be one for a lower timeframe with the 0.5 and 0.3 adr down from current high otd.
Hope you enjoy it,
Peace

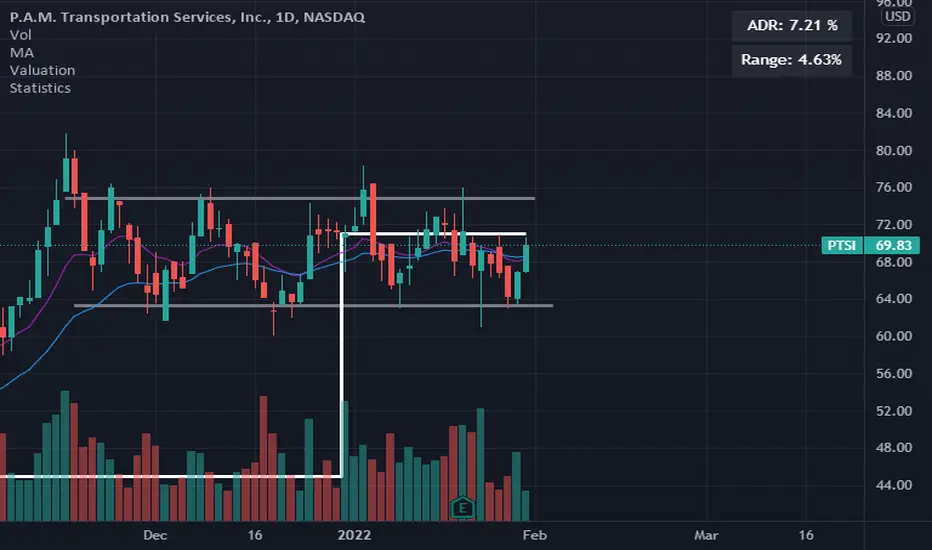
Swing Dream - PAINT BARS | MA | EMA | DMA | VWAP | TABLE | ADR %- Swing Dream -
Script created for breakout-swing traders, in the style of QullaMaggie * , Dan Zanger, Oliver Kell, and Stockbee.
The following indicators are used by most successful breakout-swing traders such as mentioned above.
(As published) it contains:
Painted Bars, also known as inside/outside candles. Used for candle analysis and to determine breakout pivots & levels. For instance; use it in different timeframes and seek formations (ex, 3-1-2). For further inspiration, study Rob Smith's The Strat .
MA, Simple Moving Averages (Basic levels = 10,20,50,200). Use this indicator to define resistance/support areas as well as the overall long/swing-term trend. In breakout strategies such as EP, Flags, etc this can be used for trailing stops; an example, post-breakout, let the price ride the 20ma before exiting your position.
EMA, Exponential Moving Averages with periods inspired by Qullamaggie (10,20,65). Use this on shorter timeframes (ex, 1h) and for the same principles as MAs.
VWAP, Volume-Weighted Average Price. As for the previous, utilize this as a level indicator to find areas of resistance/support. Good for swing-trading as it implies whenever holders are profitable or not.
DMA, Displaced Moving Average (Horizontal). Personally, I use this a lot. Works very well for trailing stops (post breakout) and "bounce" areas. Choose your own offset and period.
ADR%, Average Daily Range Percentage. Displayed in the table and used to define a symbol's volatility. A very good tool for Qullamaggie-style trading. Personally, I try to find setups with over 6% ADR. Basic definition; low ADR% = Increased chance of a symbol to move slower and in smaller ranges. A higher value equals the opposite.
Table. A table with basic symbol-related information. Could save you plenty of time whenever you scan or search for new swing setups. Looking to add more features here.
Why should you use this script? Well, instead of having tens of different indicators, use this script and combine everything together with EP, Flag, or breakout principles. Suited for every plan, and more efficient in my opinion.
View settings to turn on/off different indicators.
* If you're looking for an introduction and further explanation of how Qullamaggie uses mentioned indicators, I could recommend checking out his website, stream, or participation in "Chat With Traders".
At last, I want to credit: @jkcqld @neolao @TheScrutiniser
This Script will get updated and improved.
// TechFille006

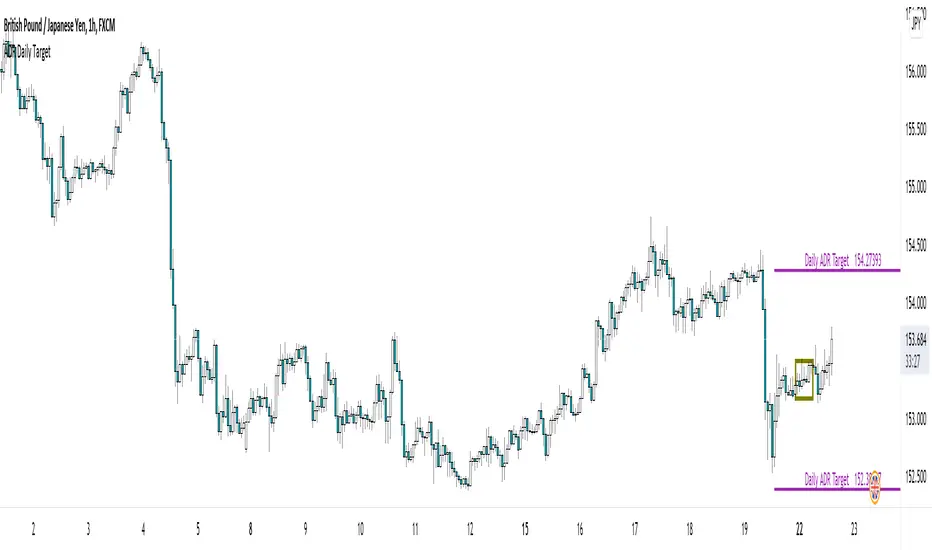
Imbalance, ADR Daily Target & ADR > 3X1 x ADR Movement Calculated on the Asian Session - Times can be altered to suit your parameters
Daily Target is set High from low of Asian Range and Low from High of Asian Range
0-3X ADR Calculated and Displayed from a point you select for the following days targets - can be set Bearish or Bullish and ADR parameters can be altered
Imbalance Finder - Can be switched on or off to show imbalance on current time frame - default is off

1 *ADRHighlights 1 ADR from High and - or Low of the day -
Helps to identify areas where your trade may reverse in the day
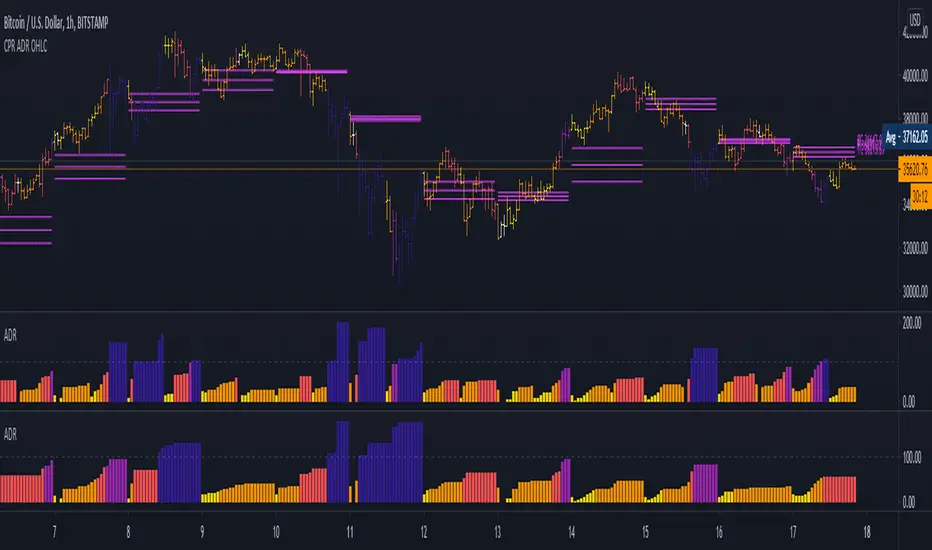
ADR PercentUses past 5 day's daily average ranges and calculates average ADR percentage with respect to latest day's open
Acknowledgement - Uses code from another excellent indicator from critian.d

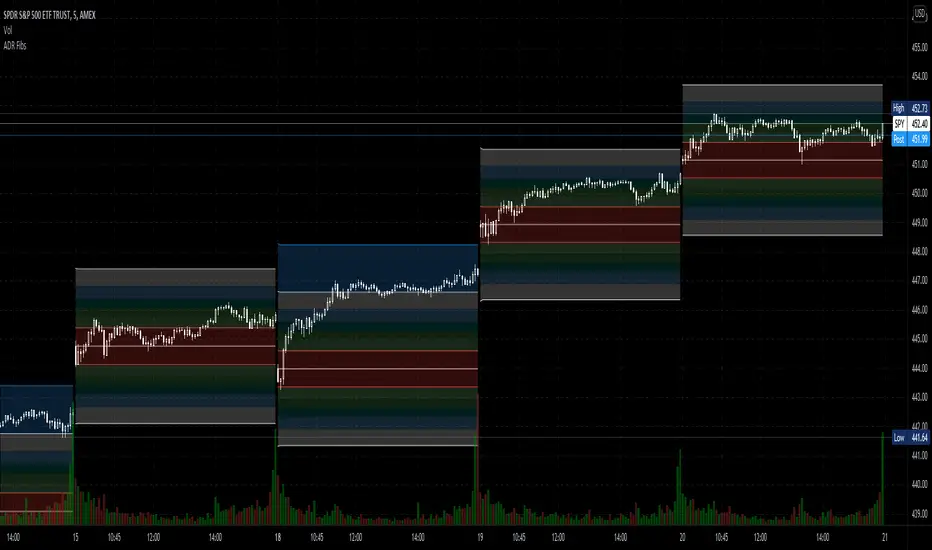
Average Daily Range Fibonacci LevelsThe Average Daily Range is a simple concept, calculated as the difference between daily highs and lows averaged over some period. This indicator uses that range in conjunction with Fibonacci ratios to create zones centered on the day's open that tends to act as areas of support and resistance.
The thicker White lines are the ADR levels; all other lines are the same value adjusted by the various Fibonacci values.
A simpler version of this concept can be seen in my other script, Average Daily Range Zones, which does not include the Fibonacci ratio zones.
Thanks to @Hank Hill for the original idea and TV for the feedback and support on the use of the security() function.
Also thanks to @GoldenCross for the Fibonacci obsession.
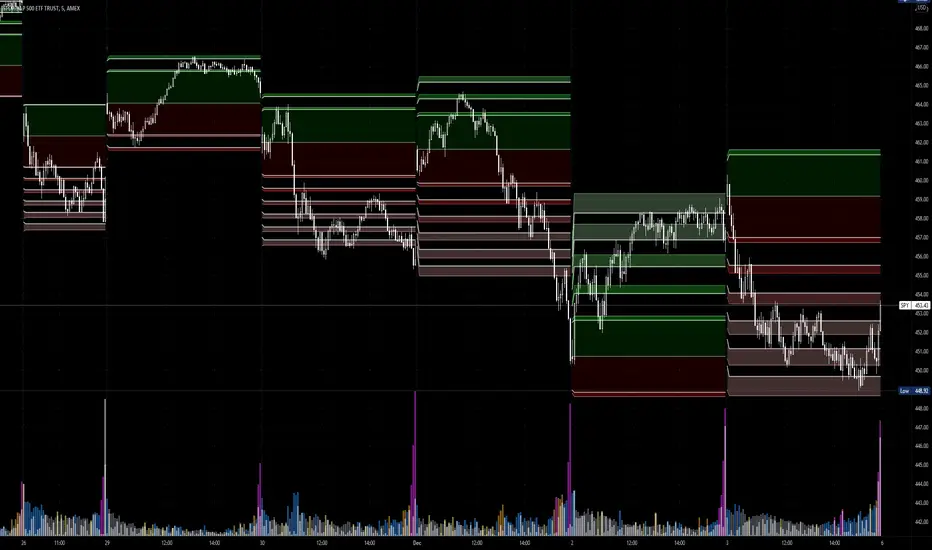
Average Daily Range ZonesThe Average Daily Range is a simple concept, calculated as the difference between daily highs and lows averaged over some period. This range is is overlaid and centered on the day's open, and tends to act as areas of support and resistance . This indicator provides two aggregation periods, creating a range that represents volatility in the ADR; a wider spread indicates greater recent volatility , and vice-versa.
Thanks to @Hank Hill for the original idea and ToS script this is based on, and TV for the feedback and support on the use of the security() function.
ADR% / ATR / LoD dist. TableDisplays the following values in a table in the upper right corner of the chart:
ADR%: Average daily range (in percent).
ATR: Average true range (hidden by default).
LoD dist.: Distance of current price to low of the day as a percentage of ATR.
All values are calculated based on daily bars, no matter what time frame you are currently viewing. Doesn't work for time frames >1D, which is why the table is not shown on weekly/monthly charts.
Credit to MikeC / TheScrutiniser and GlinckEastwoot for ADR% formula

Position Sizing w/ ADR&ATR TrackingScript to use for position sizing based on portfolio size, max position, and max loss inputs. The option to use custom entry and stop are available, but default to last price for entry, and Low of Day (LoD) for stop. The ATR % is a measure of the low of day to current price as a percentage move.
Credit to LonesomeTheBlue for the base code on position sizing and TheScrutiniser/GlinckEastwoot for ADR formula
-Nelgoth, best of luck

5 Day ADR ICT Intraday Tracker + Timeframes, Alerts, BarcolorsThis indicator gives you a hint on hypothetical room left for a trade by tracking todays current range as a percentage of the 5 Day ADR.
Look for entries in yellow and orange zones and exits on dark blue once the ADR is reached.
I just added a Timeframe, Alerts for High and Low Zones and an option to colorize the Bars/Candles to "5 Day ADR ICT Intraday Tracker" by BryceWH
ADR% - Average Daily Range % by MikeC (AKA TheScrutiniser)This applies a 'corrected' formula to the version created by alpine_trader (which is slightly off). It calculates the Average Daily Range (in percent) over the previous 20 periods and plots it in a chart.
I am grateful to GlinckEastwoot for the 'corrected' formula.

Average Daily RangeAverage Daily Range of a given period. Period is an adjustable input through setting's menu.

Average Daily Range (ADR) with variable look back periodThis script allows the user to change the look back period with a default of 7 periods. Fixed stops and/or profit targets can lead to risk mismanagement during high or low volatility conditions. For a particular setup, a profit target could be say 15% of the ADR and the stop at 10% of the ADR. ADR is sometimes preferred over ATR (Average True Range) as the former doesn't include gaps
