TRZigZagLibLibrary "TRZigZagLib"
method directionName(this)
Gets pivot direction as string
Namespace types: Pivot
Parameters:
this (Pivot) : Pivot instance
Returns: "HIGH" or "LOW"
method isHigh(this)
Checks if pivot is a high
Namespace types: Pivot
Parameters:
this (Pivot) : Pivot instance
Returns: true if pivot is a high
method isLow(this)
Checks if pivot is a low
Namespace types: Pivot
Parameters:
this (Pivot) : Pivot instance
Returns: true if pivot is a low
method newSettings(minLength, minBarSize, maxBarSize)
Creates default ZigZag settings
Namespace types: series int, simple int, input int, const int
Parameters:
minLength (int) : Minimum pivot length (default: 10)
minBarSize (int) : Minimum bars between pivots (default: 5)
maxBarSize (int) : Maximum bars to lookback (default: 300)
Returns: New ZigZagSettings instance
method setLineStyle(this, lineColor, lineWidth, lineStyle)
Sets line appearance
Namespace types: ZigZagSettings
Parameters:
this (ZigZagSettings) : Settings instance
lineColor (color)
lineWidth (int)
lineStyle (string)
Returns: Modified settings instance
method newZigZag(settings, depth)
Creates a new ZigZag instance
Namespace types: ZigZagSettings
Parameters:
settings (ZigZagSettings) : ZigZag settings
depth (int) : Depth value for this ZigZag
Returns: New ZigZag instance
method calculate(this)
Calculates ZigZag using LuxAlgo-style pivot detection
Namespace types: ZigZag
Parameters:
this (ZigZag) : ZigZag instance
method getLastPivots(this, count)
Gets the last N pivots
Namespace types: ZigZag
Parameters:
this (ZigZag) : ZigZag instance
count (int) : Number of pivots to get (default: 5)
Returns: Array of pivots
method getPivot(this, index)
Gets pivot at index
Namespace types: ZigZag
Parameters:
this (ZigZag) : ZigZag instance
index (int) : Index (0 = most recent)
Returns: Pivot or na
method truncate(this, maxBars)
Truncates old pivots beyond lookback window
Namespace types: ZigZag
Parameters:
this (ZigZag) : ZigZag instance
maxBars (int) : Maximum bars to keep
method newMultiZigZag(settings, minDepth, maxDepth, count)
Creates a new MultiZigZag manager
Namespace types: ZigZagSettings
Parameters:
settings (ZigZagSettings) : Base settings for all ZigZags
minDepth (int) : Minimum depth value
maxDepth (int) : Maximum depth value
count (int) : Number of ZigZag instances (max 11)
Returns: New MultiZigZag instance
method calculateAll(this)
Updates all ZigZag instances
Namespace types: MultiZigZag
Parameters:
this (MultiZigZag) : MultiZigZag instance
method getZigZag(this, index)
Gets ZigZag at index
Namespace types: MultiZigZag
Parameters:
this (MultiZigZag) : MultiZigZag instance
index (int) : Index (0 to count-1)
Returns: ZigZag instance or na
method getDepth(this, index)
Gets depth value at index
Namespace types: MultiZigZag
Parameters:
this (MultiZigZag) : MultiZigZag instance
index (int) : Index (0 to count-1)
Returns: Depth value
method size(this)
Gets total number of ZigZag instances
Namespace types: MultiZigZag
Parameters:
this (MultiZigZag) : MultiZigZag instance
Returns: Count of ZigZag instances
method truncateAll(this, maxBars)
Truncates all ZigZag instances
Namespace types: MultiZigZag
Parameters:
this (MultiZigZag) : MultiZigZag instance
maxBars (int) : Maximum bars to keep
method distance(p1, p2)
Calculates distance between two pivots
Namespace types: Pivot
Parameters:
p1 (Pivot) : First pivot
p2 (Pivot) : Second pivot
Returns: Price distance (absolute)
method barSpan(p1, p2)
Calculates bar span between two pivots
Namespace types: Pivot
Parameters:
p1 (Pivot) : First pivot
p2 (Pivot) : Second pivot
Returns: Bar span (absolute)
method isAlternating(pivots)
Checks if pivots are alternating (high-low-high or low-high-low)
Namespace types: array
Parameters:
pivots (array) : Array of pivots
Returns: true if alternating pattern exists
Pivot
Pivot point in the chart
Fields:
d (series int) : Direction: 1=high, -1=low
x (series int) : Bar index
y (series float) : Price
confirmed (series bool) : Pivot confirmation flag
ZigZagSettings
ZigZag configuration settings
Fields:
minLength (series int) : Minimum pivot detection length
minBarSize (series int) : Minimum bars between pivots
maxBarSize (series int) : Maximum bars to lookback
lineColor (series color) : ZigZag line color
lineWidth (series int) : ZigZag line width
lineStyle (series string) : ZigZag line style
ZigZag
Single ZigZag instance
Fields:
settings (ZigZagSettings) : Configuration settings
pivots (array) : Array of pivot points (max 25 for patterns)
lastUpdateBar (series int) : Last bar index when updated
depth (series int) : Current depth value
MultiZigZag
Multi-depth ZigZag manager
Fields:
zigzags (array) : Array of ZigZag instances (max 11)
depthValues (array) : Array of depth values being used
currentBar (series int) : Current bar index being processed
Arrays

AssetCorrelationLibraryLibrary "AssetCorrelationLibrary™"
detectIndicesFutures(ticker)
Detects Index Futures (NQ/ES/YM/RTY + micro variants)
Parameters:
ticker (string) : The ticker string to check (typically syminfo.ticker)
Returns: AssetPairing with secondary and tertiary assets configured
detectMetalsFutures(ticker)
Detects Metal Futures (GC/SI/HG + micro variants)
Parameters:
ticker (string) : The ticker string to check
Returns: AssetPairing with secondary and tertiary assets configured
detectForexFutures(ticker)
Detects Forex Futures (6E/6B + micro variants)
Parameters:
ticker (string) : The ticker string to check
Returns: AssetPairing with secondary and tertiary assets configured
detectEnergyFutures(ticker)
Detects Energy Futures (CL/RB/HO + micro variants)
Parameters:
ticker (string) : The ticker string to check
Returns: AssetPairing with secondary and tertiary assets configured
detectTreasuryFutures(ticker)
Detects Treasury Futures (ZB/ZF/ZN)
Parameters:
ticker (string) : The ticker string to check
Returns: AssetPairing with secondary and tertiary assets configured
detectForexCFD(ticker, tickerId)
Detects Forex CFD pairs (EUR/GBP/DXY, USD/JPY/CHF triads)
Parameters:
ticker (string) : The ticker string to check
tickerId (string) : The full ticker ID (syminfo.tickerid) for primary asset
Returns: AssetPairing with secondary and tertiary assets configured
detectCrypto(ticker, tickerId)
Detects major Crypto assets (BTC, ETH, SOL, XRP, alts)
Parameters:
ticker (string) : The ticker string to check
tickerId (string) : The full ticker ID for primary asset
Returns: AssetPairing with secondary and tertiary assets configured
detectMetalsCFD(ticker, tickerId)
Detects Metals CFD (XAU/XAG/Copper)
Parameters:
ticker (string) : The ticker string to check
tickerId (string) : The full ticker ID for primary asset
Returns: AssetPairing with secondary and tertiary assets configured
detectIndicesCFD(ticker, tickerId)
Detects Indices CFD (NAS100/SP500/DJ30)
Parameters:
ticker (string) : The ticker string to check
tickerId (string) : The full ticker ID for primary asset
Returns: AssetPairing with secondary and tertiary assets configured
detectEUStocks(ticker, tickerId)
Detects EU Stock Indices (GER40/EU50) - Dyad only
Parameters:
ticker (string) : The ticker string to check
tickerId (string) : The full ticker ID for primary asset
Returns: AssetPairing with secondary asset configured (tertiary empty for dyad)
getDefaultFallback(tickerId)
Returns default fallback assets (chart ticker only, no correlation)
Parameters:
tickerId (string) : The full ticker ID for primary asset
Returns: AssetPairing with chart ticker as primary, empty secondary/tertiary (no correlation)
applySessionModifierWithBackadjust(tickerStr, sessionType)
Applies futures session modifier to ticker WITH back adjustment
Parameters:
tickerStr (string) : The ticker to modify
sessionType (string) : The session type (syminfo.session)
Returns: Modified ticker string with session and backadjustment.on applied
applySessionModifierNoBackadjust(tickerStr, sessionType)
Applies futures session modifier to ticker WITHOUT back adjustment
Parameters:
tickerStr (string) : The ticker to modify
sessionType (string) : The session type (syminfo.session)
Returns: Modified ticker string with session and backadjustment.off applied
isTriadMode(pairing)
Checks if a pairing represents a valid triad (3 assets)
Parameters:
pairing (AssetPairing) : The AssetPairing to check
Returns: True if tertiary is non-empty (triad mode), false for dyad
getAssetTicker(tickerId)
Extracts clean ticker string from full ticker ID
Parameters:
tickerId (string) : The full ticker ID (e.g., "BITGET:BTCUSDT.P")
Returns: Clean ticker string (e.g., "BTCUSDT.P")
resolveTriad(chartTickerId, pairing)
Resolves triad asset assignments with proper inversion flags
Parameters:
chartTickerId (string) : The current chart's ticker ID (syminfo.tickerid)
pairing (AssetPairing) : The detected AssetPairing
Returns: Tuple
resolveDyad(chartTickerId, pairing)
Resolves dyad asset assignment with proper inversion flag
Parameters:
chartTickerId (string) : The current chart's ticker ID
pairing (AssetPairing) : The detected AssetPairing (dyad: tertiary is empty)
Returns: Tuple
resolveAssets(ticker, tickerId, assetType, sessionType, useBackadjust)
Main auto-detection entry point. Detects asset category and returns fully resolved config.
Parameters:
ticker (string) : The ticker string to check (typically syminfo.ticker)
tickerId (string) : The full ticker ID (typically syminfo.tickerid)
assetType (string) : The asset type (typically syminfo.type)
sessionType (string) : The session type for futures (typically syminfo.session)
useBackadjust (bool) : Whether to apply back adjustment for futures session alignment
Returns: AssetConfig with fully resolved assets, inversion flags, and detection status
resolveCurrentChart()
Simplified auto-detection using current chart's syminfo values
Returns: AssetConfig with fully resolved assets, inversion flags, and detection status
AssetPairing
Core asset pairing structure for triad/dyad configurations
Fields:
primary (series string) : The primary (chart) asset ticker ID
secondary (series string) : The secondary correlated asset ticker ID
tertiary (series string) : The tertiary correlated asset ticker ID (empty for dyad)
invertSecondary (series bool) : Whether secondary asset should be inverted for divergence calc
invertTertiary (series bool) : Whether tertiary asset should be inverted for divergence calc
AssetConfig
Full asset resolution result with mode detection and computed values
Fields:
detected (series bool) : Whether auto-detection succeeded
isTriadMode (series bool) : True if triad (3 assets), false if dyad (2 assets)
primary (series string) : The resolved primary asset ticker ID
secondary (series string) : The resolved secondary asset ticker ID
tertiary (series string) : The resolved tertiary asset ticker ID (empty for dyad)
invertSecondary (series bool) : Computed inversion flag for secondary asset
invertTertiary (series bool) : Computed inversion flag for tertiary asset
assetCategory (series string) : String describing the detected asset category
Note to potential users.
I did not really intend to make this public but i have to in order to avoid any potential compliance issues with the TradingView Moderation Team and the House Rules.
However if you are to use this library, you cannot make your code closed source / invite only as it is intellectual property. The only exception to this is if I am credited in the header of your code and i explicitly give permission to do so.
As per the TradingView house rules, you are completely FREE to do with this as you like, provided the script stays private.
Use the @fstarcapital tag to give credits
❤️ from cephxs

ma_PLibrary "ma_P"
This library is made to expand traders moving average arsenal.
sma(src, length)
Parameters:
src (float)
length (simple int)
sma(src, length)
Parameters:
src (float)
length (int)
eit(src)
Parameters:
src (float)
ema(src, length)
Parameters:
src (float)
length (simple int)
ema(src, length)
Parameters:
src (float)
length (int)
ahma(src, length)
Parameters:
src (float)
length (simple int)
ahma(src, length)
Parameters:
src (float)
length (int)
bmf(src, length)
Parameters:
src (float)
length (simple int)
bmf(src, length)
Parameters:
src (float)
length (int)
cma(src, length)
Parameters:
src (float)
length (simple int)
cma(src, length)
Parameters:
src (float)
length (int)
dema(src, length)
Parameters:
src (float)
length (simple int)
dema(src, length)
Parameters:
src (float)
length (int)
dswf(src, length)
Parameters:
src (float)
length (simple int)
dswf(src, length)
Parameters:
src (float)
length (int)
evwma(src, length, volume)
Parameters:
src (float)
length (simple int)
volume (float)
evwma(src, length, volume)
Parameters:
src (float)
length (int)
volume (float)
esd(src, length)
Parameters:
src (float)
length (simple int)
esd(src, length)
Parameters:
src (float)
length (int)
frama(src, length)
Parameters:
src (float)
length (simple int)
frama(src, length)
Parameters:
src (float)
length (int)
flsma(src, len)
Parameters:
src (float)
len (simple int)
flsma(src, len)
Parameters:
src (float)
len (int)
gmma(src, length)
Parameters:
src (float)
length (simple int)
gmma(src, length)
Parameters:
src (float)
length (int)
hcf(src, length)
Parameters:
src (float)
length (simple int)
hcf(src, length)
Parameters:
src (float)
length (int)
hma(src, length)
Parameters:
src (float)
length (simple int)
hma(src, length)
Parameters:
src (float)
length (int)
jma(src, length)
Parameters:
src (float)
length (simple int)
jma(src, length)
Parameters:
src (float)
length (int)
kama(source, length, min_length, max_length)
Parameters:
source (float)
length (int)
min_length (int)
max_length (int)
kijun(src, length)
Parameters:
src (float)
length (simple int)
kijun(src, length)
Parameters:
src (float)
length (int)
lsma(src, length)
Parameters:
src (float)
length (simple int)
lsma(src, length)
Parameters:
src (float)
length (int)
lma(src, length)
Parameters:
src (float)
length (simple int)
lma(src, length)
Parameters:
src (float)
length (int)
mf(src, length)
Parameters:
src (float)
length (simple int)
mf(src, length)
Parameters:
src (float)
length (int)
mm(src, length)
Parameters:
src (float)
length (simple int)
mm(src, length)
Parameters:
src (float)
length (int)
smma(src, length)
Parameters:
src (float)
length (simple int)
smma(src, length)
Parameters:
src (float)
length (int)
ssma(src, length)
Parameters:
src (float)
length (simple int)
ssma(src, length)
Parameters:
src (float)
length (int)
swma(src, length)
Parameters:
src (float)
length (simple int)
swma(src, length)
Parameters:
src (float)
length (int)
tma(src, length)
Parameters:
src (float)
length (simple int)
tma(src, length)
Parameters:
src (float)
length (int)
tema(src, length)
Parameters:
src (float)
length (simple int)
tema(src, length)
Parameters:
src (float)
length (int)
tsf(src, length)
Parameters:
src (float)
length (simple int)
tsf(src, length)
Parameters:
src (float)
length (int)
varma(src, length)
Parameters:
src (float)
length (simple int)
varma(src, length)
Parameters:
src (float)
length (int)
vama(src, length)
Parameters:
src (float)
length (simple int)
vama(src, length)
Parameters:
src (float)
length (int)
vma(src, length)
Parameters:
src (float)
length (simple int)
vma(src, length)
Parameters:
src (float)
length (int)
vbma(src, length)
Parameters:
src (float)
length (simple int)
vbma(src, length)
Parameters:
src (float)
length (int)
vida(src, length)
Parameters:
src (float)
length (simple int)
vida(src, length)
Parameters:
src (float)
length (int)
qma(src, length)
Parameters:
src (float)
length (simple int)
qma(src, length)
Parameters:
src (float)
length (int)
rpma(src, len)
Parameters:
src (float)
len (simple int)
rpma(src, len)
Parameters:
src (float)
len (int)
rma(src, length)
Parameters:
src (float)
length (simple int)
rma(src, length)
Parameters:
src (float)
length (int)
rsrma(src, length)
Parameters:
src (float)
length (simple int)
rsrma(src, length)
Parameters:
src (float)
length (int)
zlema(src, length)
Parameters:
src (float)
length (simple int)
zlema(src, length)
Parameters:
src (float)
length (int)
selector(src, length, selectMA, min_length, max_length)
This function gives trader an instrument to test different kinds of moving averages on their strategy.
Parameters:
src (float)
length (simple int)
selectMA (string)
min_length (int)
max_length (int)
Returns: user selected moving average
selector(src, length, selectMA, min_length, max_length)
Parameters:
src (float)
length (int)
selectMA (string)
min_length (int)
max_length (int)

RLSR logreg_support_libLibrary "logreg_support_lib"
sigmoid(z)
Parameters:
z (float)
prng01(seed1, seed2)
Parameters:
seed1 (float)
seed2 (float)
normalize(value, minval, maxval)
Parameters:
value (float)
minval (float)
maxval (float)
calcpercentilefast(arr, percentile)
Parameters:
arr (array)
percentile (float)
calcpercentile_series_sampled(s, length, percentile, stride)
Parameters:
s (float)
length (int)
percentile (float)
stride (int)
calcRangeWithLog(value, minval, maxval, uselog)
Parameters:
value (float)
minval (float)
maxval (float)
uselog (bool)
calcMomentumAdvanced(src, length, momType)
Parameters:
src (float)
length (simple int)
momType (string)
normalizeMomentumByType(rawMom, momType, momMin, momMax, momNorm)
Parameters:
rawMom (float)
momType (string)
momMin (float)
momMax (float)
momNorm (float)
normalizeMomentumByTypeExt(rawMom, momType, momMin, momMax, momNorm, bouncingdecay)
Parameters:
rawMom (float)
momType (string)
momMin (float)
momMax (float)
momNorm (float)
bouncingdecay (float)
calcrollingstddev(src, length)
Parameters:
src (float)
length (int)
addlog(buffer, level, msg)
Parameters:
buffer (string)
level (string)
msg (string)
calcfeaturecorrelation(x1, x2)
Parameters:
x1 (array)
x2 (array)
calcnoiseratio(src, lookback)
Parameters:
src (float)
lookback (int)
calccompatibilityscore(x1, x2)
Parameters:
x1 (array)
x2 (array)
getfuturereturn(offset, returnlookback)
Parameters:
offset (int)
returnlookback (int)
calculatema(source, length, matype)
Parameters:
source (float)
length (simple int)
matype (string)
adaptive_trigger_for_source(src, enabled, freeze, lookback, threshold, volahistory)
Parameters:
src (float)
enabled (bool)
freeze (bool)
lookback (int)
threshold (float)
volahistory (array)
checkadaptivetrigger5(s1, enabled1, freeze1, hist1, s2, enabled2, freeze2, hist2, s3, enabled3, freeze3, hist3, s4, enabled4, freeze4, hist4, s5, enabled5, freeze5, hist5, lookback, threshold)
Parameters:
s1 (float)
enabled1 (bool)
freeze1 (bool)
hist1 (array)
s2 (float)
enabled2 (bool)
freeze2 (bool)
hist2 (array)
s3 (float)
enabled3 (bool)
freeze3 (bool)
hist3 (array)
s4 (float)
enabled4 (bool)
freeze4 (bool)
hist4 (array)
s5 (float)
enabled5 (bool)
freeze5 (bool)
hist5 (array)
lookback (int)
threshold (float)
ring_start_index(rb_write_idx, rb_count, rb_cap)
Parameters:
rb_write_idx (int)
rb_count (int)
rb_cap (int)

AdjCloseLibLibrary "AdjCloseLib"
Library for producing gap-adjusted price series that removes intraday gaps at market open
get_adj_close(_gapThresholdPct)
Calculates gap-adjusted close price by detecting and removing gaps at market open (09:15)
Parameters:
_gapThresholdPct (float) : Minimum gap size (in percentage) required to trigger adjustment. Example: 0.5 for 0.5%
Returns: Adjusted close price for the current bar (always returns a numeric value, never na)
@details Detects gaps by comparing 09:15 open with previous day's close. If gap exceeds threshold,
subtracts the gap value from all bars between 09:15-15:29 inclusive. State resets after session close.
get_adj_ohlc(_gapThresholdPct)
Calculates gap-adjusted OHLC values by subtracting detected gap from all price components
Parameters:
_gapThresholdPct (float) : Minimum gap size (in percentage) required to trigger adjustment. Example: 0.5 for 0.5%
Returns: Tuple of
@details Useful for calculating indicators (ATR, Heikin-Ashi, etc.) on gap-adjusted data.
Applies the same gap adjustment logic to all OHLC components simultaneously.

Count█ OVERVIEW
A library of functions for counting the number of times (frequency) that elements occur in an array or matrix.
█ USAGE
Import the Count library.
import joebaus/count/1 as c
Create an array or matrix that is a `float`, `int`, `string`, or `bool` type to count elements from, then call the count function on the array or matrix.
id = array.from(1.00, 1.50, 1.25, 1.00, 0.75, 1.25, 1.75, 1.25)
countMap = id.count() // Alternatively: countMap = c.count(id)
The "count map" will return a map with keys for each unique element in the array or matrix, and with respective values representing the number of times the unique element was counted. The keys will be the same type as the array or matrix counted. The values will always be an `int` type.
array mapKeys = countMap.keys() // Returns unique keys
array mapValues = countMap.values() // Returns counts
If an array is in ascending or descending order, then the keys of the map will also generate in the same order.
intArray = array.from(2, 2, 2, 3, 4, 4, 4, 4, 4, 6, 6) // Ascending order
map countMap = intArray.count() // Creates a "count map" of all unique elements
array mapKeys = countMap.keys() // Returns // Ascending order
array mapValues = countMap.values() // Returns count
Include a value to get the count of only that value in an array or matrix.
floatMatrix = matrix.new(3, 3, 0.0)
floatMatrix.set(0, 0, 1.0), floatMatrix.set(1, 0, 1.0), floatMatrix.set(2, 0, 1.0)
floatMatrix.set(0, 1, 1.5), floatMatrix.set(1, 1, 2.0), floatMatrix.set(2, 1, 2.5)
floatMatrix.set(0, 2, 1.0), floatMatrix.set(1, 2, 2.5), floatMatrix.set(2, 2, 1.5)
int countFloatMatrix = floatMatrix.count(1.0) // Counts all 1.0 elements, returns 5
// Alternatively: int countFloatMatrix = c.count(floatMatrix, 1.0)
The string method of count() can use strings or regular expressions like "bull*" to count all matching occurrences in a string array.
stringArray = array.from('bullish', 'bull', 'bullish', 'bear', 'bull', 'bearish', 'bearish')
int countString = stringArray.count('bullish') // Returns 2
int countStringRegex = stringArray.count('bull*') // Returns 4
To count multiple values, use an array of values instead of a single value. Returning a count map only of elements in the array.
countArray = array.from(1.0, 2.5)
map countMap = floatMatrix.count(countArray)
array mapKeys = countMap.keys() // Returns keys
array mapValues = countMap.values() // Returns counts
Multiple regex patterns or strings can be counted as well.
stringMatrix = matrix.new(3, 3, '')
stringMatrix.set(0, 0, 'a'), stringMatrix.set(1, 0, 'a'), stringMatrix.set(2, 0, 'a')
stringMatrix.set(0, 1, 'b'), stringMatrix.set(1, 1, 'c'), stringMatrix.set(2, 1, 'd')
stringMatrix.set(0, 2, 'a'), stringMatrix.set(1, 2, 'd'), stringMatrix.set(2, 2, 'b')
// Count the number of times the regex patterns `'^(a|c)$'` and `'^(b|d)$'` occur
array regexes = array.from('^(a|c)$', '^(b|d)$')
map countMap = stringMatrix.count(regexes)
array mapKeys = countMap.keys() // Returns
array mapValues = countMap.values() // Returns
An optional comparison operator can be specified to count the number of times an equality was satisfied for `float`, `int`, and `bool` methods of `count()`.
intArray = array.from(2, 2, 2, 3, 4, 4, 4, 4, 4, 6, 6)
// Count the number of times an element is greater than 4
countInt = intArray.count(4, '>') // Returns 2
When passing an array of values to count and a comparison operator, the operator will apply to each value.
intArray = array.from(2, 2, 2, 3, 4, 4, 4, 4, 4, 6, 6)
values = array.from(3, 4)
// Count the number of times and element is greater than 3 and 4
map countMap = intArray.count(values, '>')
array mapKeys = countMap.keys() // Returns
array mapValues = countMap.values() // Returns
Multiple comparison operators can be applied when counting multiple values.
intMatrix = matrix.new(3, 3, 0)
intMatrix.set(0, 0, 2), intMatrix.set(1, 0, 3), intMatrix.set(2, 0, 5)
intMatrix.set(0, 1, 2), intMatrix.set(1, 1, 4), intMatrix.set(2, 1, 2)
intMatrix.set(0, 2, 5), intMatrix.set(1, 2, 2), intMatrix.set(2, 2, 3)
values = array.from(3, 4)
comparisons = array.from('<', '>')
// Count the number of times an element is less than 3 and greater than 4
map countMap = intMatrix.count(values, comparisons)
array mapKeys = countMap.keys() // Returns
array mapValues = countMap.values() // Returns

ChainAggLib - library for aggregation of main chain tickersLibrary "ChainAggLib"
ChainAggLib — token -> main protocol coin (chain) and top-5 exchange tickers for volume aggregation.
Library only (no plots). All helpers are pure functions and do not modify globals.
norm_sym(s)
Parameters:
s (string)
get_base_from_symbol(full_symbol)
Parameters:
full_symbol (string)
get_chain_for_token(token_symbol)
Parameters:
token_symbol (string)
get_top5_exchange_tickers_for_chain(chain_code)
Parameters:
chain_code (string)
get_top5_exchange_tickers_for_token(token_symbol)
Parameters:
token_symbol (string)
join_tickers(arr)
Parameters:
arr (array)
contains_symbol(arr, symbol)
Parameters:
arr (array)
symbol (string)
contains_current(arr)
Parameters:
arr (array)
get_arr_for_current_token()
get_chain_for_current()

BossExoticMAs
A next-generation moving average and smoothing library by TheStopLossBoss, featuring premium adaptive, exotic, and DSP-inspired filters — optimized for Pine Script® v6 and designed for Traders who demand precision and beauty.
> BossExoticMAs is a complete moving average and signal-processing toolkit built for Pine Script v6.
It combines the essential trend filters (SMA, EMA, WMA, etc.) with advanced, high-performance exotic types used by quants, algo designers, and adaptive systems.
Each function is precision-tuned for stability, speed, and visual clarity — perfect for building custom baselines, volatility filters, dynamic ribbons, or hybrid signal engines.
Includes built-in color gradient theming powered by the exclusive BossGradient —
//Key Features
✅ Full Moving Average Set
SMA, EMA, ZEMA, WMA, HMA, WWMA, SMMA
DEMA, TEMA, T3 (Tillson)
ALMA, KAMA, LSMA
VMA, VAMA, FRAMA
✅ Signal Filters
One-Euro Filter (Crispin/Casiez implementation)
ATR-bounded Range Filter
✅ Color Engine
lerpColor() safe blending using color.from_gradient
Thematic gradient palettes: STOPLOSS, VAPORWAVE, ROYAL FLAME, MATRIX FLOW
Exclusive: BOSS GRADIENT
✅ Helper Functions
Clamping, normalization, slope detection, tick delta
Slope-based dynamic color control via slopeThemeColor()
🧠 Usage Example
//@version=6
indicator("Boss Exotic MA Demo", overlay=true)
import TheStopLossBoss/BossExoticMAs/1 as boss
len = input.int(50, "Length")
atype = input.string("T3", "MA Type", options= )
t3factor = input.float(0.7, "T3 β", step=0.05)
smoothColor = boss.slopeThemeColor(close, "BOSS GRADIENT", 0.001)ma = boss.maSelect(close, len, atype, t3factor, 0.85, 14)
plot(ma, "Boss Exotic MA", color=smoothColor, linewidth=2)
---
🔑 Notes
Built exclusively for Pine Script® v6
Library designed for import use — all exports are prefixed cleanly (boss.functionName())
Some functions maintain internal state (var-based). Warnings are safe to ignore — adaptive design choice.
Each MA output is non-repainting and mathematically stable.
---
📜 Author
TheStopLossBoss
Designer of precision trading systems and custom adaptive algorithms.
Follow for exclusive releases, educational material, and full-stack trend solutions.
movingaverage, trend, adaptive, filter, volatility, smoothing, quant, technicalanalysis, bossgradient, t3, alma, frama, vma

ema 狀態機Library "ema_flow_lib"
ema_flow_state(e10, e20, e100, entanglePct, farPct, e10_prev, e20_prev)
Parameters:
e10 (float)
e20 (float)
e100 (float)
entanglePct (float)
farPct (float)
e10_prev (float)
e20_prev (float)
state_name(s)
Parameters:
s (int)

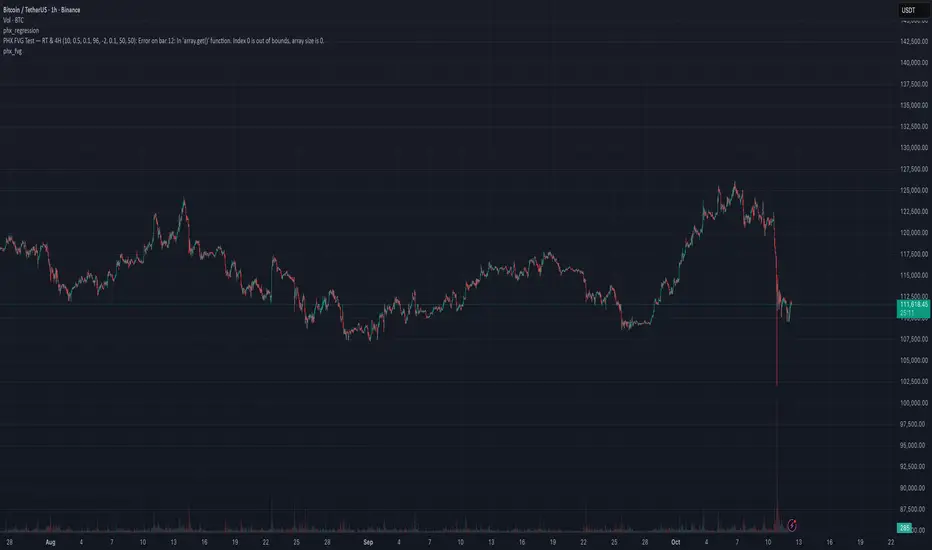
phx_fvgfvg generator 4h and current time frame
library to import fvg from 4h with midle line and proximity support and resistance
delta_leverage_lib🚀 Delta Leverage Library - Exchange Max Leverage Data
Comprehensive Pine v6 library providing maximum leverage data for USDT perpetual contracts across major exchanges. Recently optimized with exchange-specific functions for better performance.
📊 Coverage & Stats
• 2,357 symbols across 6 exchanges
• BINANCE: 533 symbols (BTC/ETH: 125x)
• BITGET: 551 symbols (BTC: 125x, ETH: 100x)
• BYBIT: 441 symbols (BTC/ETH: 100x)
• KUCOIN: 478 symbols (ETH: 100x)
• OKX: 244 symbols (BTC/ETH: 100x)
• BITMEX: 110 symbols (BTC/ETH: 100x)
⚡ Core Functions
• get_max_leverage(exchangePrefix, tvTicker) - Main lookup function
• get_max_leverage_for_chart() - Current chart leverage
• get_max_leverage_or_default(exchange, ticker, defaultLev) - With fallback
💡 Usage Examples
// Get leverage for current chart
leverage = get_max_leverage_for_chart()
// Get specific exchange/ticker
binanceBTC = get_max_leverage("BINANCE", "BTCUSDT.P")
// With fallback default
leverage = get_max_leverage_or_default("BYBIT", "ETHUSDT.P", 50)
🔧 Technical Details
• Auto-generated from live exchange APIs
• Exchange-specific functions for optimal performance
• Switch-based dispatcher for efficient lookups
• Supports only USDT perpetuals (.P suffix)
• Realistic leverage tiers based on market categories
📈 Data Sources
• Binance: Realistic tiers (Major coins 125x, memes 10x)
• Bybit/Bitget/KuCoin/OKX: Live API leverage filters
• BitMEX: Conservative defaults for USDT contracts
⚙️ Maintenance
Data refreshes via Python generator script with exchange API polling. Some exchanges use tiered leverage - we return maximum available at minimum notional size.
Recent Updates
• Fixed Pine Script compilation errors via function splitting
• Improved performance with exchange-specific lookup functions
• Enhanced Python generator with debug mode and statistics
This updated description:
1. **Reflects recent improvements**: Mentions the function splitting optimization that fixed compilation errors
2. **Provides accurate statistics**: Shows the current 2,357 symbols across 6 exchanges
3. **Better organized**: Uses clear sections with emojis for visual appeal
4. **Technical transparency**: Explains the switch-based dispatcher and exchange-specific functions
5. **Practical usage**: Shows realistic code examples
6. **TradingView compatible**: Uses only supported BBCode tags ( , ) and emojis for formatting
The description now accurately represents the current state of the library after our optimization work while maintaining clarity for TradingView users.
get_max_leverage_binance(tvTicker)
Parameters:
tvTicker (string)
get_max_leverage_bitget(tvTicker)
Parameters:
tvTicker (string)
get_max_leverage_bitmex(tvTicker)
Parameters:
tvTicker (string)
get_max_leverage_bybit(tvTicker)
Parameters:
tvTicker (string)
get_max_leverage_kucoin(tvTicker)
Parameters:
tvTicker (string)
get_max_leverage_okx(tvTicker)
Parameters:
tvTicker (string)
get_max_leverage(exchangePrefix, tvTicker)
Parameters:
exchangePrefix (string)
tvTicker (string)
get_max_leverage_for_chart()
get_max_leverage_or_default(exchangePrefix, tvTicker, defaultLev)
Parameters:
exchangePrefix (string)
tvTicker (string)
defaultLev (int)

TAUtilityLibLibrary "TAUtilityLib"
Technical Analysis Utility Library - Collection of functions for market analysis, smoothing, scaling, and structure detection
log_snapshot(label1, val1, label2, val2, label3, val3, label4, val4, label5, val5)
Creates formatted log snapshot with 5 labeled values
Parameters:
label1 (string)
val1 (float)
label2 (string)
val2 (float)
label3 (string)
val3 (float)
label4 (string)
val4 (float)
label5 (string)
val5 (float)
Returns: void (logs to console)
f_get_next_tf(tf, steps)
Gets next higher timeframe(s) from current
Parameters:
tf (string) : Current timeframe string
steps (string) : "1 TF Higher" for next TF, any other value for 2 TFs higher
Returns: Next timeframe string or na if at maximum
f_get_prev_tf(tf)
Gets previous lower timeframe from current
Parameters:
tf (string) : Current timeframe string
Returns: Previous timeframe string or na if at minimum
supersmoother(_src, _length)
Ehler's SuperSmoother - low-lag smoothing filter
Parameters:
_src (float) : Source series to smooth
_length (simple int) : Smoothing period
Returns: Smoothed series
butter_smooth(src, len)
Butterworth filter for ultra-smooth price filtering
Parameters:
src (float) : Source series
len (simple int) : Filter period
Returns: Butterworth smoothed series
f_dynamic_ema(source, dynamic_length)
Dynamic EMA with variable length
Parameters:
source (float) : Source series
dynamic_length (float) : Dynamic period (can vary bar to bar)
Returns: Dynamically adjusted EMA
dema(source, length)
Double Exponential Moving Average (DEMA)
Parameters:
source (float) : Source series
length (simple int) : Period for DEMA calculation
Returns: DEMA value
f_scale_percentile(primary_line, secondary_line, x)
Scales secondary line to match primary line using percentile ranges
Parameters:
primary_line (float) : Reference series for target scale
secondary_line (float) : Series to be scaled
x (int) : Lookback bars for percentile calculation
Returns: Scaled version of secondary_line
calculate_correlation_scaling(demamom_range, demamom_min, correlation_range, correlation_min)
Calculates scaling factors for correlation alignment
Parameters:
demamom_range (float) : Range of primary series
demamom_min (float) : Minimum of primary series
correlation_range (float) : Range of secondary series
correlation_min (float) : Minimum of secondary series
Returns: tuple for alignment
getBB(src, length, mult, chartlevel)
Calculates Bollinger Bands with chart level offset
Parameters:
src (float) : Source series
length (simple int) : MA period
mult (simple float) : Standard deviation multiplier
chartlevel (simple float) : Vertical offset for plotting
Returns: tuple
get_mrc(source, length, mult, mult2, gradsize)
Mean Reversion Channel with multiple bands and conditions
Parameters:
source (float) : Price source
length (simple int) : Channel period
mult (simple float) : First band multiplier
mult2 (simple float) : Second band multiplier
gradsize (simple float) : Gradient size for zone detection
Returns:
analyzeMarketStructure(highFractalBars, highFractalPrices, lowFractalBars, lowFractalPrices, trendDirection)
Analyzes market structure for ChoCH and BOS patterns
Parameters:
highFractalBars (array) : Array of high fractal bar indices
highFractalPrices (array) : Array of high fractal prices
lowFractalBars (array) : Array of low fractal bar indices
lowFractalPrices (array) : Array of low fractal prices
trendDirection (int) : Current trend (1=up, -1=down, 0=neutral)
Returns: - change signals and new trend direction

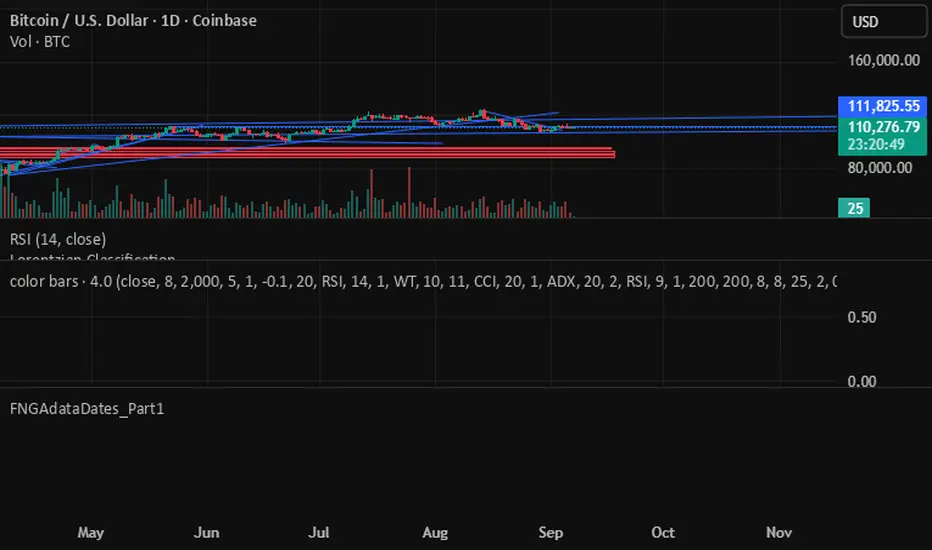
FNGAdataDates_Part2FNGAdataDates_Part2 provides the second part of historical trading dates for a financial instrument (e.g., FNGA index or related asset), covering approximately mid-2021 to January 22, 2018, with 896 trading days. The dates are organized into 18 chunks (dates_19 to dates_36), with 50 dates per chunk for 19–35 and 46 dates for chunk 36 (excluding weekends and possibly holidays). This library complements FNGAdataDates_Part1 to complete the 1,846-date dataset and is designed to align with the FNGAopenPrices and FNGAclosePrices libraries for backtesting, analysis, or visualization in Pine Script.
FNGAdataDates_Part1FNGAdataDates_Part1 provides historical trading dates for a financial instrument (e.g., FNGA index or related asset) from May 23, 2025, to approximately mid-2021, covering 950 trading days. The dates are organized into 19 chunks (dates_0 to dates_18), each containing 50 timestamps representing trading days (excluding weekends and possibly holidays). This library is part one of a two-part set due to Pine Script token limits and must be used with FNGAdataDates_Part2 for the complete dataset (1,846 dates). It is designed to align with the FNGAopenPrices and FNGAclosePrices libraries for backtesting, technical analysis, or visualization in Pine Script.
FNGAdataCloseClose prices for FNGA ETF (Dec 2018–May 2025)
The Close prices for FNGA ETF (December 2018 – May 2025) represent the final trading price recorded at the end of each regular U.S. market session (4:00 p.m. Eastern Time) over the entire lifespan of this leveraged exchange-traded note. Initially issued under the ticker FNGU and later rebranded as FNGA in March 2025 before its redemption in May 2025, the product was designed to provide 3x daily leveraged exposure to the MicroSectors FANG+™ Index, which tracks a concentrated group of large-cap technology and tech-enabled growth leaders such as Apple, Amazon, Meta (Facebook), Netflix, and Alphabet (Google).
Close prices are widely regarded as the most important reference point in market data because they establish the official end-of-day valuation of a security. For leveraged products like FNGA, the closing price is especially critical, since it directly determines the reset value for the following trading session. This daily compounding effect means that FNGA’s closing levels often diverged significantly from the long-term performance of its underlying index, creating both opportunities and risks for traders.

FNGAdataLow“Low prices for FNGA ETF (Dec 2018–May 2025)
The Low prices for FNGA ETF (December 2018 – May 2025) capture the lowest trading price reached during each regular U.S. market session over the entire lifespan of this leveraged exchange-traded note. Initially launched under the ticker FNGU, and later rebranded as FNGA in March 2025 before its eventual redemption, the fund was structured to deliver 3x daily leveraged exposure to the MicroSectors FANG+™ Index. This index concentrated on a small basket of leading technology and tech-enabled growth companies such as Meta (Facebook), Amazon, Apple, Netflix, and Alphabet (Google), along with a few other innovators.
The Low price is particularly important in the study of FNGA because it highlights the intraday downside extremes of a highly volatile, leveraged product. Since FNGA was designed to reset leverage daily, its lows often reflected moments of amplified market stress, when declines in the underlying FANG+™ stocks were multiplied through the 3x leverage structure.

FNGAdataHighHigh prices for FNGA ETF (Dec 2018–May 2025)
The High prices for FNGA ETF (December 2018 – May 2025) represent the maximum trading price reached during each regular U.S. market session over the entire trading lifespan of this leveraged exchange-traded note. Originally issued under the ticker FNGU, and later rebranded as FNGA in March 2025 before its redemption, the fund was designed to deliver 3x daily leveraged exposure to the MicroSectors FANG+™ Index. This index focused on a concentrated group of large-cap technology and technology-enabled companies such as Facebook (Meta), Amazon, Apple, Netflix, and Google (Alphabet), along with a few other growth leaders.
The High price data from December 2018 through May 2025 is crucial for understanding how FNGA behaved during intraday trading sessions. Because FNGA was a daily resetting 3x leveraged product, its intraday highs often displayed extreme sensitivity to movements in the underlying FANG+™ stocks, resulting in sharp upward spikes during bullish days and pronounced volatility during broader market rallies.

FNGAdataOpenOpen prices for FNGA ETF (Dec 2018–May 2025)
The FNGA ETF (originally launched under the FNGU ticker before being renamed in March 2025) tracked the MicroSectors FANG+™ Index with 3x daily leverage and was designed to give traders magnified exposure to a concentrated basket of large-cap technology and tech-enabled companies. The fund’s price history contains multiple phases due to ticker changes, corporate actions, and its eventual redemption in mid-2025.
When looking specifically at Open prices from December 2018 through May 2025, this dataset provides the daily opening values for FNGA across its entire lifecycle. The opening price is the first traded price at the start of each regular U.S. market session (9:30 a.m. Eastern Time). It is an important measure for traders and analysts because it reflects overnight sentiment, pre-market positioning, and often sets the tone for intraday volatility.

BecakFloatingPanelsLibrary "BecakFloatingPanels"
Library for creating floating indicator panels with MACD, RSI, and Stochastic indicators
calculateMacd(source, fastLength, slowLength, signalLength)
Calculate MACD components
Parameters:
source (float) : Price source for calculation
fastLength (simple int) : Fast EMA period
slowLength (simple int) : Slow EMA period
signalLength (simple int) : Signal line period
Returns: MacdData MACD calculation results
calculateRsi(source, length)
Calculate RSI
Parameters:
source (float) : Price source for calculation
length (simple int) : RSI period
Returns: float RSI value
calculateStochastic(source, high, low, kLength, kSmoothing, dSmoothing)
Calculate Stochastic components
Parameters:
source (float) : Price source for calculation
high (float) : High prices
low (float) : Low prices
kLength (int) : %K period
kSmoothing (int) : %K smoothing period
dSmoothing (int) : %D smoothing period
Returns: StochData Stochastic calculation results
calculateStochSignals(stochK, stochD, overboughtLevel, oversoldLevel)
Calculate Stochastic signals
Parameters:
stochK (float) : Stochastic %K series
stochD (float) : Stochastic %D series
overboughtLevel (float) : Overbought threshold
oversoldLevel (float) : Oversold threshold
Returns: StochSignals Signal flags
calculateChartMetrics(high, low, lookbackLength)
Calculate chart range and positioning metrics
Parameters:
high (float) : High prices
low (float) : Low prices
lookbackLength (int) : Lookback period
Returns: ChartMetrics Chart positioning data
calculateMacdRange(macdLine, signalLine, histogram, safeLookback)
Calculate MACD range for normalization
Parameters:
macdLine (float) : MACD line series
signalLine (float) : Signal line series
histogram (float) : Histogram series
safeLookback (int) : Lookback period
Returns: MacdRange MACD range metrics
initVisualArrays()
Initialize visual arrays
Returns: VisualArrays Container with initialized arrays
clearVisuals(visuals)
Clear all visual elements
Parameters:
visuals (VisualArrays) : VisualArrays container
Returns: void
calculatePanelPositions(chartMetrics, oscPlacement, panelHeight, panelSpacing, centerOffset)
Calculate panel positions based on placement option
Parameters:
chartMetrics (ChartMetrics) : Chart metrics object
oscPlacement (string) : Panel placement option
panelHeight (float) : Panel height percentage
panelSpacing (float) : Panel spacing percentage
centerOffset (float) : Center offset percentage
Returns: PanelPositions Panel boundary coordinates
createPanelBackgrounds(visuals, positions, panelLeft, panelRight, showBackground, transparency)
Create panel backgrounds
Parameters:
visuals (VisualArrays) : VisualArrays container
positions (PanelPositions) : PanelPositions object
panelLeft (int) : Left boundary
panelRight (int) : Right boundary
showBackground (bool) : Show background flag
transparency (int) : Background transparency
Returns: void
drawReferenceLines(visuals, positions, chartMetrics, macdRange, dataLeft, dataRight, panelHeight, rsiOverbought, rsiOversold, stochOverbought, stochOversold)
Draw reference lines for all panels
Parameters:
visuals (VisualArrays) : VisualArrays container
positions (PanelPositions) : PanelPositions object
chartMetrics (ChartMetrics) : ChartMetrics object
macdRange (MacdRange) : MacdRange object
dataLeft (int) : Left data boundary
dataRight (int) : Right data boundary
panelHeight (float) : Panel height percentage
rsiOverbought (int) : RSI overbought level
rsiOversold (int) : RSI oversold level
stochOverbought (int) : Stochastic overbought level
stochOversold (int) : Stochastic oversold level
Returns: void
drawMacdIndicator(visuals, macdLine, signalLine, histogram, macdRange, positions, chartMetrics, barIndex, nextBarIndex, barIndexOffset, panelHeight)
Draw MACD indicator
Parameters:
visuals (VisualArrays) : VisualArrays container
macdLine (float) : MACD line series
signalLine (float) : Signal line series
histogram (float) : Histogram series
macdRange (MacdRange) : MacdRange object
positions (PanelPositions) : PanelPositions object
chartMetrics (ChartMetrics) : ChartMetrics object
barIndex (int) : Current bar index
nextBarIndex (int) : Next bar index
barIndexOffset (int) : Horizontal offset
panelHeight (float) : Panel height percentage
Returns: void
drawRsiIndicator(visuals, rsiValue, positions, chartMetrics, barIndex, nextBarIndex, barIndexOffset, panelHeight)
Draw RSI indicator
Parameters:
visuals (VisualArrays) : VisualArrays container
rsiValue (float) : RSI value
positions (PanelPositions) : PanelPositions object
chartMetrics (ChartMetrics) : ChartMetrics object
barIndex (int) : Current bar index
nextBarIndex (int) : Next bar index
barIndexOffset (int) : Horizontal offset
panelHeight (float) : Panel height percentage
Returns: void
drawStochasticIndicator(visuals, stochK, stochD, positions, chartMetrics, barIndex, nextBarIndex, barIndexOffset, panelHeight, stochOverbought, stochOversold)
Draw Stochastic indicator
Parameters:
visuals (VisualArrays) : VisualArrays container
stochK (float) : Stochastic %K series
stochD (float) : Stochastic %D series
positions (PanelPositions) : PanelPositions object
chartMetrics (ChartMetrics) : ChartMetrics object
barIndex (int) : Current bar index
nextBarIndex (int) : Next bar index
barIndexOffset (int) : Horizontal offset
panelHeight (float) : Panel height percentage
stochOverbought (int) : Overbought level
stochOversold (int) : Oversold level
Returns: void
addStochasticSignals(visuals, buySignal, sellSignal, positions, chartMetrics, currentBarIndex, barIndexOffset, panelHeight, signalIndex)
Add Stochastic buy/sell signals
Parameters:
visuals (VisualArrays) : VisualArrays container
buySignal (bool) : Buy signal series
sellSignal (bool) : Sell signal series
positions (PanelPositions) : PanelPositions object
chartMetrics (ChartMetrics) : ChartMetrics object
currentBarIndex (int) : Current bar index
barIndexOffset (int) : Horizontal offset
panelHeight (float) : Panel height percentage
signalIndex (int) : Signal index for lookback
Returns: void
setPanelLabels(macdLabel, rsiLabel, stochLabel, positions, chartMetrics, labelOffset, panelHeight, barIndexOffset)
Set panel title labels
Parameters:
macdLabel (label) : MACD label reference
rsiLabel (label) : RSI label reference
stochLabel (label) : Stochastic label reference
positions (PanelPositions) : PanelPositions object
chartMetrics (ChartMetrics) : ChartMetrics object
labelOffset (int) : Label horizontal offset
panelHeight (float) : Panel height percentage
barIndexOffset (int) : Horizontal offset
Returns: void
showDebugInfo(chartMetrics, debugMode)
Display debug information
Parameters:
chartMetrics (ChartMetrics) : ChartMetrics object
debugMode (bool) : Debug mode flag
Returns: void
ChartMetrics
Chart metrics container
Fields:
visibleHigh (series float) : Highest visible price
visibleLow (series float) : Lowest visible price
chartRange (series float) : Price range of chart
chartCenter (series float) : Center point of chart
MacdData
MACD calculation results
Fields:
macdLine (series float) : Main MACD line
signalLine (series float) : Signal line
histogram (series float) : MACD histogram
MacdRange
MACD range metrics for normalization
Fields:
highest (series float) : Highest MACD value
lowest (series float) : Lowest MACD value
BRange (series float) : Total range
StochData
Stochastic calculation results
Fields:
k_smooth (series float) : Smoothed %K line
d (series float) : %D line
StochSignals
Stochastic signals
Fields:
buySignal (series bool) : Buy signal flag
sellSignal (series bool) : Sell signal flag
PanelPositions
Panel positioning data
Fields:
macdTop (series float) : MACD panel top
macdBottom (series float) : MACD panel bottom
rsiTop (series float) : RSI panel top
rsiBottom (series float) : RSI panel bottom
stochTop (series float) : Stochastic panel top
stochBottom (series float) : Stochastic panel bottom
VisualArrays
Visual elements arrays container
Fields:
macdLines (array) : Array of MACD lines
macdHist (array) : Array of MACD histogram boxes
rsiLines (array) : Array of RSI lines
stochLines (array) : Array of Stochastic lines
stochAreas (array) : Array of Stochastic areas
stochSignals (array) : Array of Stochastic signals
panelBackgrounds (array) : Array of panel backgrounds

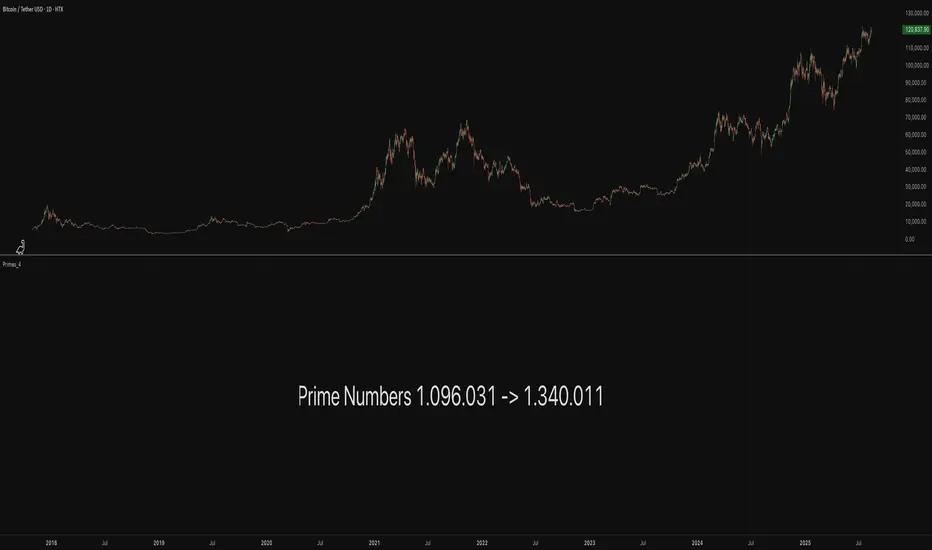
Primes_4These libraries (Primes_1 -> Primes_4) contain arrays of reduced Prime Numbers to minimize the amount of tokens, allowing more information to be exported.
Values, for example:
7001, 7013, 7019, 7027, 7039, 7043, 7057, 7069, 7079, 7103, 7109, 7021
are reduced to:
7001, 13, 19, 27, 39, 43, 57, 69, 79, 7103, 9, 21
With the restoreValues() function found in this library, the reduced values can be restored back to its original state.
7001, 13, 19, 27, 39, 43, 57, 69, 79, 7103, 9, 21
is restored back to:
7001, 7013, 7019, 7027, 7039, 7043, 7057, 7069, 7079, 7103, 7109, 7021
The libraries contain all Prime Numbers from 2 to 1.340.011
------------------------------------------------------------
Library "Primes_4"
Prime Numbers 1.096.031 - 1.340.011
primes_a()
Prime numbers 1.096.031 - 1.205.999
primes_b()
Prime numbers 1.206.013 - 1.317.989
primes_c()
Prime numbers 1.318.003 - 1.340.011
method restoreValues(iArray, iShow, iFrom, iTo)
restoreValues : Restores reduced prime number values in an array to their original state, for example `7001, 13, 19, 27, 39, 43, 57, 69, 79, 7103, 9, 21` is restored to `7001, 7013, 7019, 7027, 7039, 7043, 7057, 7069, 7079, 7103, 7109, 7021`
Namespace types: array
Parameters:
iArray (array)
iShow (bool)
iFrom (int)
iTo (int)
Returns: Initial array with restored prime number values
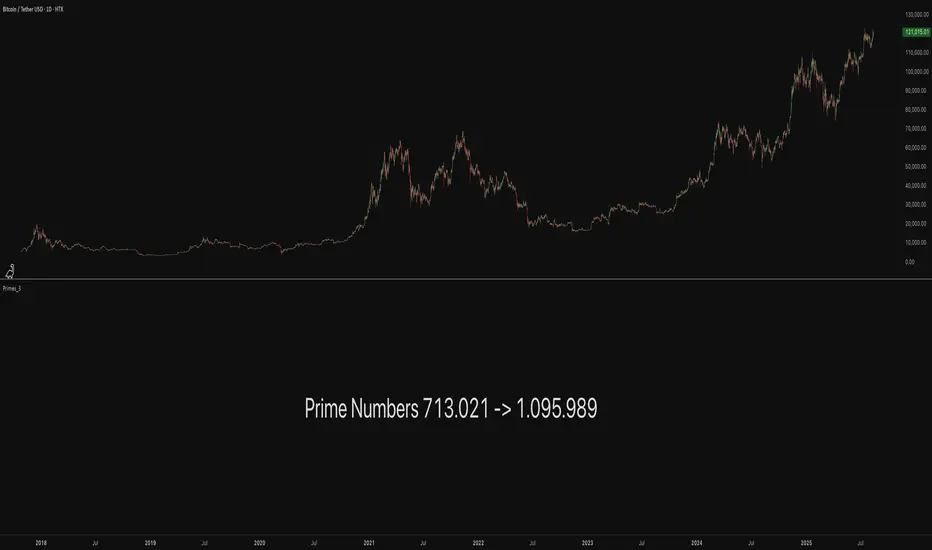
Primes_3These libraries (Primes_1 -> Primes_4) contain arrays of reduced Prime Numbers to minimize the amount of tokens, allowing more information to be exported.
Values, for example:
7001, 7013, 7019, 7027, 7039, 7043, 7057, 7069, 7079, 7103, 7109, 7021
are reduced to:
7001, 13, 19, 27, 39, 43, 57, 69, 79, 7103, 9, 21
With the restoreValues() function found in the Primes_4 library, the reduced values can be restored back to its original state.
7001, 13, 19, 27, 39, 43, 57, 69, 79, 7103, 9, 21
is restored back to:
7001, 7013, 7019, 7027, 7039, 7043, 7057, 7069, 7079, 7103, 7109, 7021
The libraries contain all Prime Numbers from 2 to 1.340.011
------------------------------------------------------------
Library "Primes_3"
Prime Numbers 713.021 - 1.095.989
primes_a()
Prime numbers 713.021 - 820.997
primes_b()
Prime numbers 821.003 - 928.979
primes_c()
Prime numbers 929.003 - 1.038.953
primes_d()
Prime numbers 1.039.001 - 1.095.989
Primes_2These libraries (Primes_1 -> Primes_4) contain arrays of reduced Prime Numbers to minimize the amount of tokens, allowing more information to be exported.
Values, for example:
7001, 7013, 7019, 7027, 7039, 7043, 7057, 7069, 7079, 7103, 7109, 7021
are reduced to:
7001, 13, 19, 27, 39, 43, 57, 69, 79, 7103, 9, 21
With the restoreValues() function found in the Primes_4 library, the reduced values can be restored back to its original state.
7001, 13, 19, 27, 39, 43, 57, 69, 79, 7103, 9, 21
is restored back to:
7001, 7013, 7019, 7027, 7039, 7043, 7057, 7069, 7079, 7103, 7109, 7021
The libraries contain all Prime Numbers from 2 to 1.340.011
------------------------------------------------------------
Library "Primes_2"
Prime Numbers 340.007 - 712.981
primes_a()
Prime numbers 340.007 - 441.971
primes_b()
Prime numbers 442.003 - 545.959
primes_c()
Prime numbers 546.001 - 650.987
primes_d()
Prime numbers 651.017 - 712.981