ATR
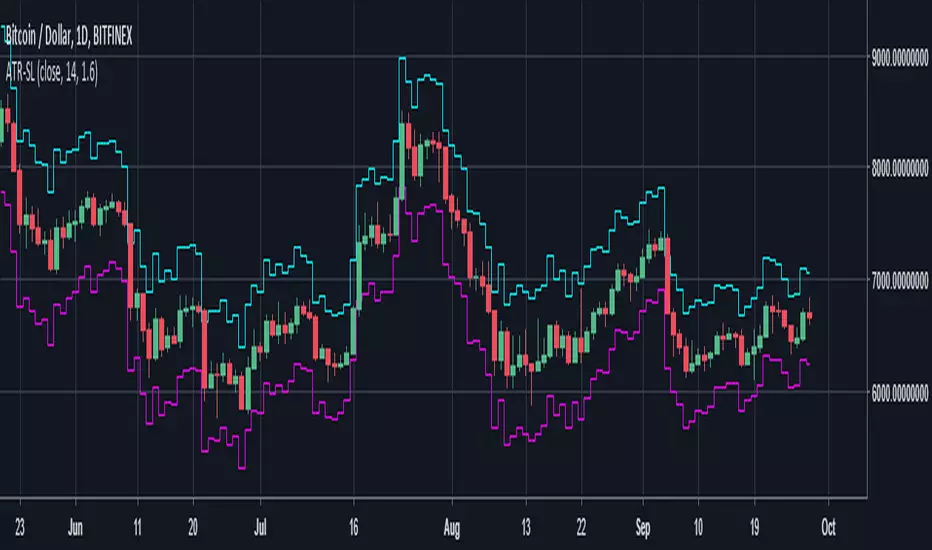
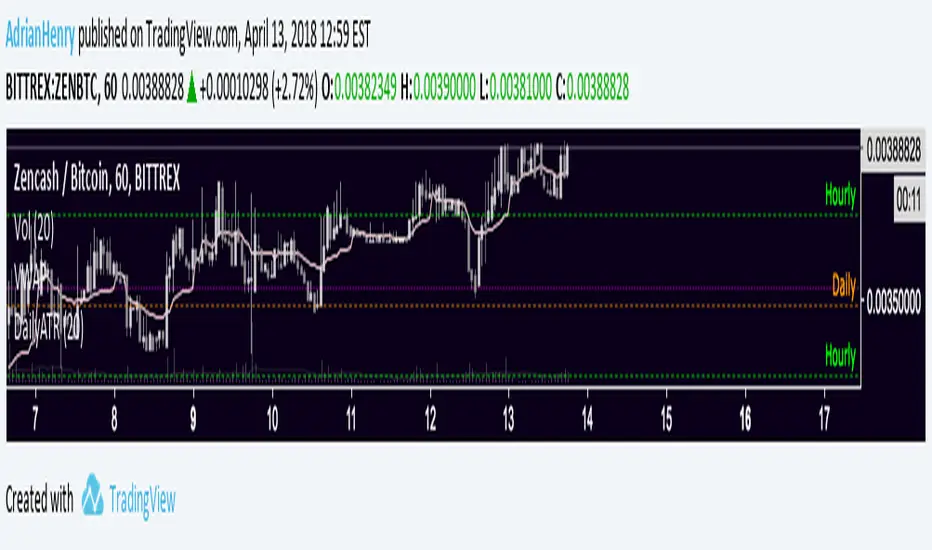
VWAP ATRATR Trailing stoploss with VWAP for confirmation and entry/exit points
VWAP resets on ATR cross


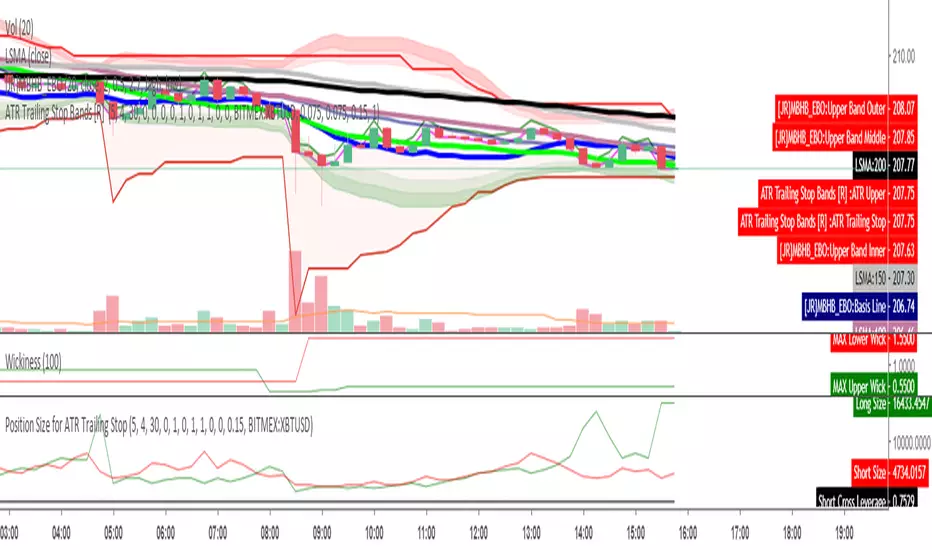
Position Size for ATR Trailing StopThis indicator will calculate your position size, short or long, based on the ATR Trailing Stop indicator of mine, and are needed to be used together. General risk management suggests risking just 1 percent of your equity and using low leverage.
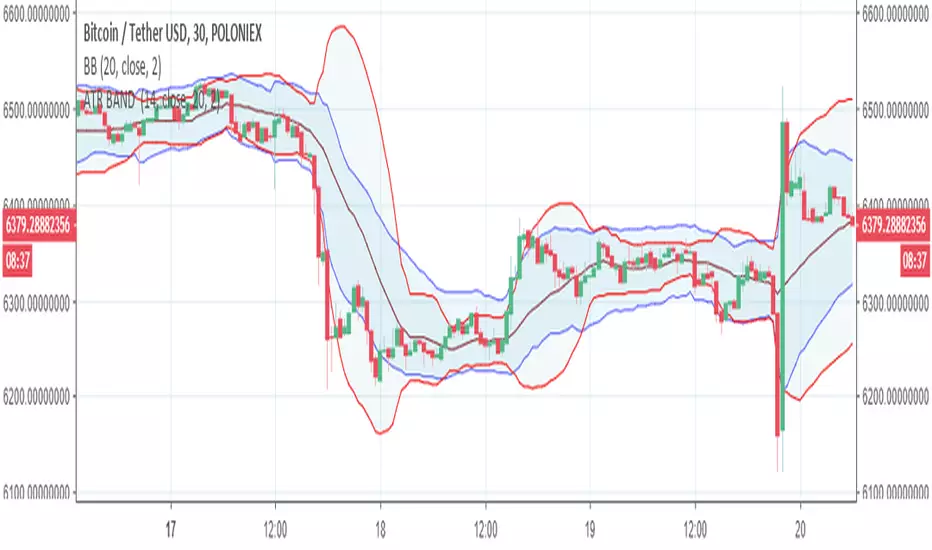
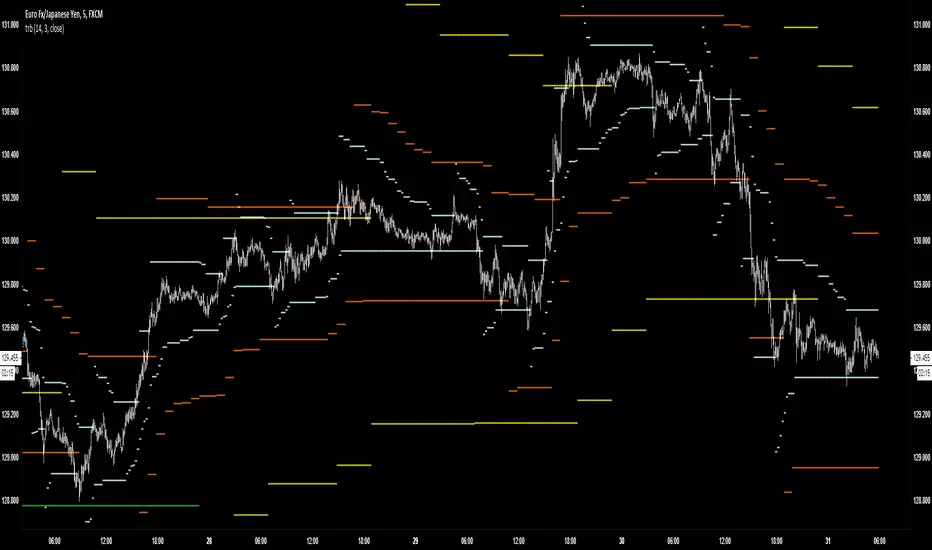
TRBTrue Range Bands; the 'Supertrend', also known as a volatility stop, using a 14 period length and 3x multiplier.

Hull MA +- ATR by shoxi Added HMA-ATR and HMA+ATR to make easier taking profits and placing stop losses in intraday trading.

RSI Swing Signal - ChartThis indicator is the chart version intended to accompany my custom RSI oscillator:
CLICK HERE TO SEE BASE INDICATOR
CLICK HERE TO SEE BASE INDICATOR

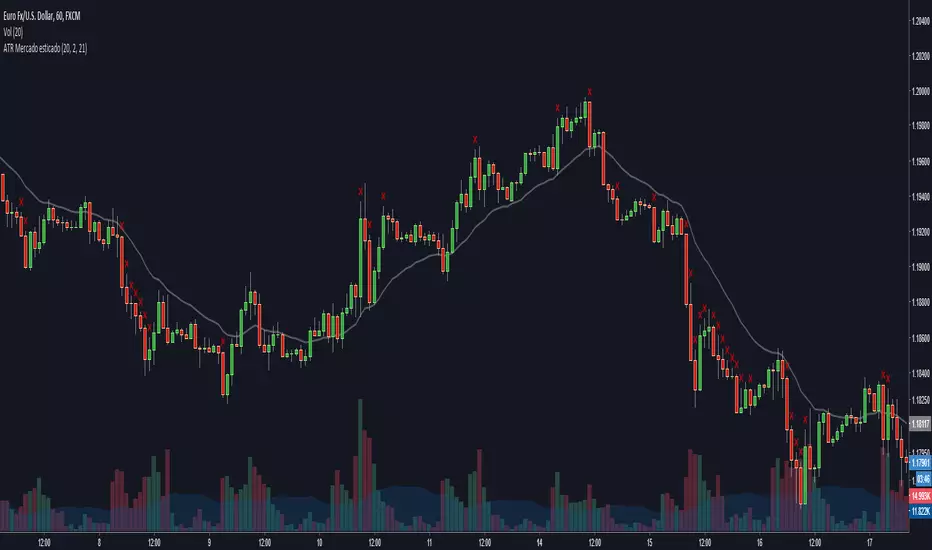
ATR Stretched Market [zauoyds]This indicator verify the close in comparison with EMA21. If the number is higher than 2ATR, the X is ploted above the candle.
Avoid positions when the candle is marked.
The best entries always will be close to the averages.
You can change the values through the inputs, according with your trade system.
ATR Short [zauoyds]This script was made to calculate in real time the stop and take profit based on ATR to SHORT positions. By default, the number is 1,5 ATR to stop-loss and 3 ATR to take profit. You can change according to your trading system.

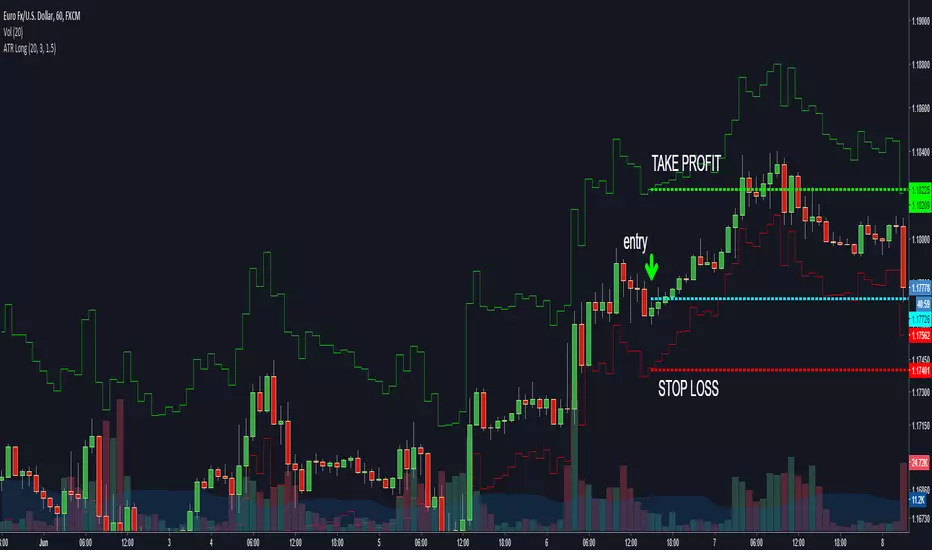
ATR Long [zauoyds]This script was made to calculate in real time the stop and take profit based on ATR to LONG positions. By default, the number is 1,5 ATR to stop-loss and 3 ATR to take profit. You can change according to your trading system.
Volatility Direction DetectorThis script helps trader identify volatility direction in order to classify each market move. It also provides good entry points.

Index Adaptive Keltner Channels [DW]This study is an experiment in adaptive filtering. The process in this study was inspired by KAMA and ZLEMA filtering techniques.
First, data is given an optional modification for lag reduction.
Then, an adaptive filter of your choice is calculated. There are 6 different adaptive filters to choose from in this study:
-Commodity Channel Index Adaptive Moving Average (CCIAMA)
-Relative Strength Index Adaptive Moving Average (RSIAMA)
-%R Adaptive Moving Average (%RAMA)
-Klinger Volume Oscillator Adaptive Moving Average (KVOAMA)
-Money Flow Index Adaptive Moving Average (MFIAMA)
-Correlation Coefficient Adaptive Moving Average (CCAMA)
Next, ATR is calculated using the specified adaptive filter.
A set of ranges is calculated by multiplying ATR by the square root of the sampling period, then dividing it by 2 and 4.
And Finally, the ranges are added to and subtracted from the adaptive filter to generate the channels.
Custom bar colors are included. The formula for the color scheme is based on filter direction and price.

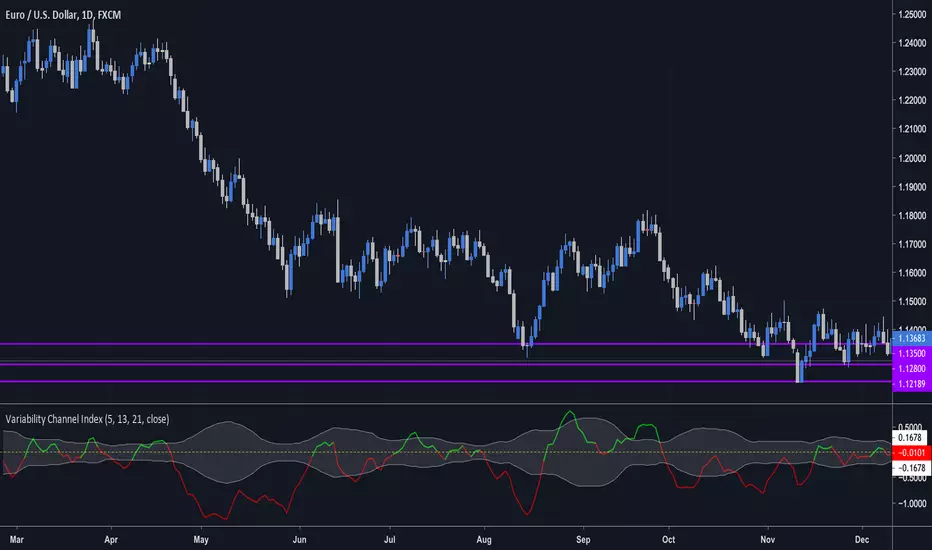
Variability Channel Index (by vitelot)This is a momentum, trend, as well as a divergence indicator.
It is similar to CCI, though it is based on a slow and fast EMA in connection to ATR, which
allows to interprete it easily.
Both EMAs and ATR have customisable period.
Further explanation and basic usage can be found in the comment section inside the script.
%ATR - TCTAThe enhanced version of %ATR of "codermua"
The %ATR calculated by EMA(red) , SMA(purple) and WMA(yellow) added to existing indicator which include only RMA(blue) calculation.

Fractal Regression Bands [DW]This study is an experimental regression curve built around fractal and ATR calculations.
First, Williams Fractals are calculated, and used as anchoring points.
Next, high anchor points are connected to negative sloping lines, and low anchor points to positive sloping lines. The slope is a specified percentage of the current ATR over the sampling period.
The median between the positive and negative sloping lines is then calculated, then the best fit line (linear regression) of the median is calculated to generate the basis line.
Lastly, a Golden Mean ATR is taken of price over the sampling period and multiplied by 1/2, 1, 2, and 3. The results are added and subtracted from the basis line to generate the bands.
Williams Fractals are included in the plots. The color scheme indicated whether each fractal is engulfing or non-engulfing.
Custom bar color scheme is included.

FIBONACCI BANDS by KIVANCfr3762Calculated with a default value of 14 periods of EMA and 14 periods of Average True Range ( SMA )
There are 4 levels of upper bands and 4 levels of lower bands in the indicator
its calculated adding and subtracting ATR( SMA ) values with coefficients 1, 1.618, 2.618 and 4.236 (Fibonacci ratios) to EMA of close prices.
Top and Bottom Fibo lines are aceepted as significant Resistance and Support levels.

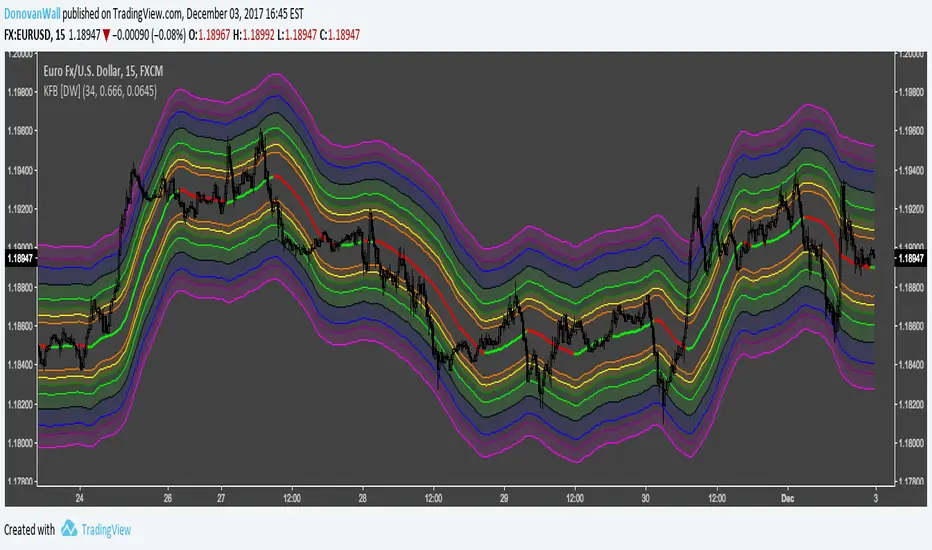
KAMA Fibonacci Bands [DW]This study is an experimental combination of the Kaufman Adaptive Moving Average with ATR and Fibonacci percentages.