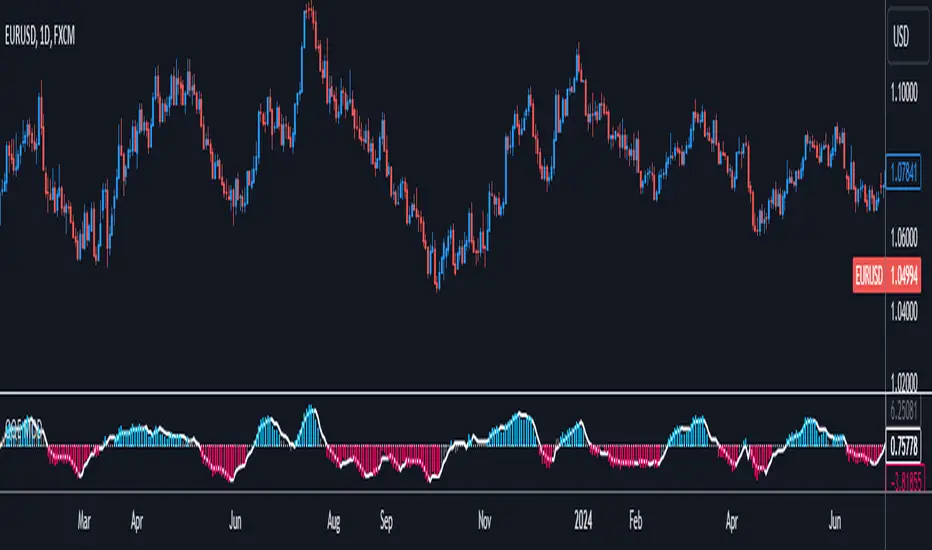
QQE MODSince there has been some demand for the QQE (Qualitative Quantitative Estimation ) figured I should upload my modified version of it as well.
The Orginal script is from Glaz, this is not my original idea - all I did was pretty much smash two QQEs together.
So there are Two QQEs in one script, right? One that is shown on the chart as columns, and the other "hidden" in the background which also has a 50 MA bollinger band acting as a zero line.
When both of them agree - you get a blue or a red bar.
حدود بولنجر
Bollinger Band BreakoutIt is a long only strategy.
1. Buy when price breaks out of the upper band.
2. Exit has two options. Option 1 allows you to exit using lower band. Option 2 allows you to exit using moving average.
3. Option 1 preferred over option 2 if the instrument is highly volatile.
4. Slippage and commissions are not considered in the return calculation.

CryptoBandsGuru MultiColor Bollinger BandsHere are my Bollinger Bands that come with 2 std dev bands and a variety of moving averages. The bands can have shading between the bands and the middle section can be shaded.
Moving Averages include:
SMA
EMA
Weighted
Hull
Symmetrical
Volume Weighted
Wilder
Right now my 2 favorites are the Hull with a std dev of .5 and the Wilder with a std dev of 1.7 and 2.0.
You can get some really good signals buy putting both on the same chart. The faster Hull will move above and below the slower Wilder and show good price action.

Bollinger Bands BAT/USDT 30minThis is ready to use Bollinger Band strategy that was backtested on the data from the previous year 2019.
The main purpose of this strategy is to determine trades with the highest probability of success, to keep a consistent portfolio growth throughout the year. This strategy cherry-picks the most reliable points of entry on a particular timeframe (30m) for the particular asset (BAT/USDT). The backtest shows a great result of 78.95% profitability with the maximum drawdown of -4.02%. This is one of my strategies out of the group of automated strategies that helps to grow my portfolio steadily.
You are welcome to change inputs and backtest the following strategy. Any comments or ideas would be appreciated.
If you are happy with existing results and would like to automate the strategy, which can be done through alerts, then you need to convert it to study and add alerts in the code.
Let me know if you are interested in that and I will create a study based on this strategy.

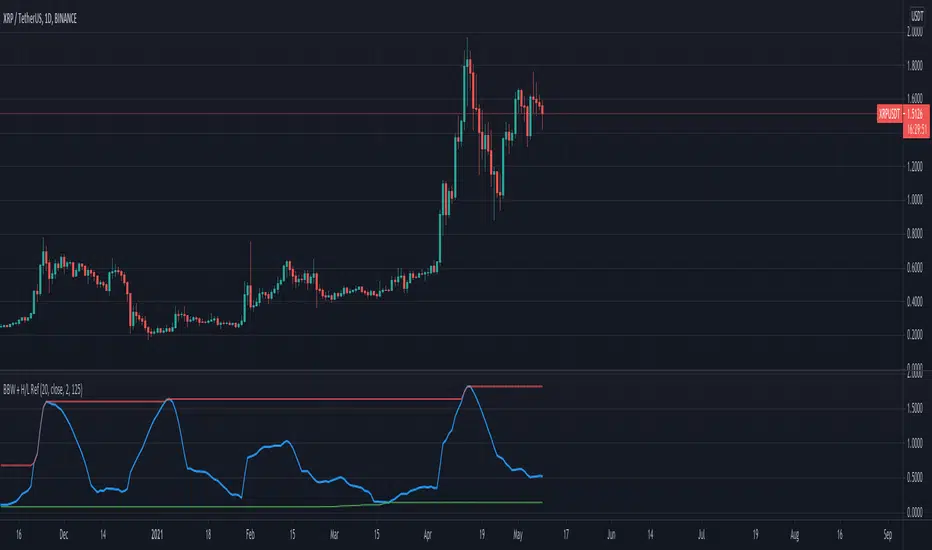
Bollinger BandWidth With High/Low ReferencesThis indicator ads option to compare BandWidth accross time. John Bollinger says he uses 125 period.
[PX] MTF Standard Deviation LevelHello guys,
once again, I want to show you a different method for detecting support and resistance level. Today's approach is similar to the one I posted recently, but the way the level will be detected is different. I call it the multi-timeframe standard deviation level.
How does it work?
The method is similar to the way Bollinger Bands work. First, the indicator calculates the standard deviation, which can be influenced by the "Sensitivity"- and "Length"-setting.
Sensitiitiy - the higher the value, the fewer level will be shown
Length - simply the length for the standard deviation formula
Second, the detected value will be added (for resistance level) or substracted (for support level) from the current close. Once the upper or lower boundaries are crossed, a level will appear and keeps moving until the up- or downward movement finishes. Then the level will settle and stay in place.
Again, as seen in my previous indicator, you can control all the different styles and colors for the levels. The best part is, the whole thing works in a multi-timeframe fashion. In an example, you could select the "Daily" level and plot them on a 4-hour chart.
If you find this indicator useful, please leave a "like" and hit that "follow" button :)
Have fun, happy trading and once again Merry Christmas :)))

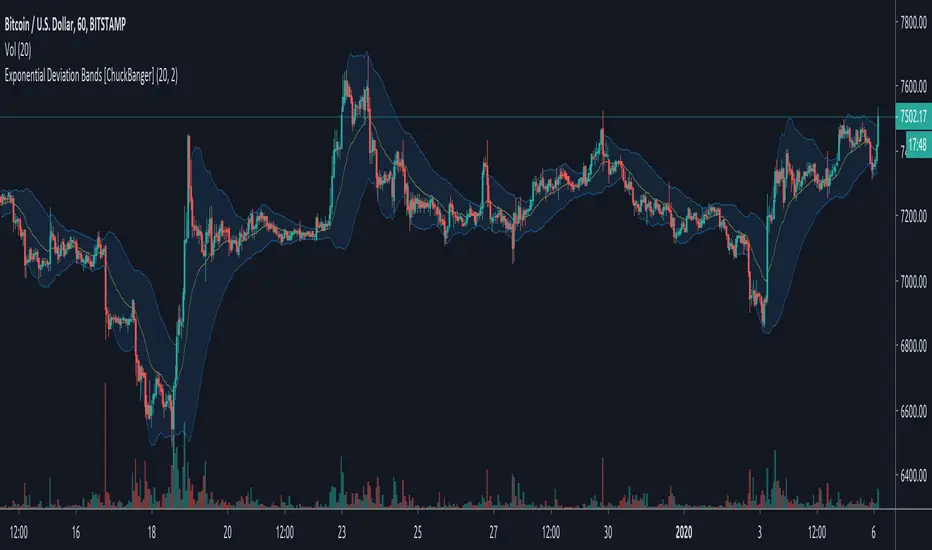
Exponential Deviation Bands [ChuckBanger]This is Exponential Deviation Bands. It is a price band indicator based on exponential deviation rather than the more traditional standard deviation, as you find in the well-known Bollinger Bands calculation. As compared to standard deviation bands, exponential deviation bands apply more weight to recent data and generate fewer breakouts. There fore it is a much better tool to identifying trends.
One strategy on the daily can be
Buy next bar if closing price crosses below the lower bands
Sell if price is equal to the current value of the upper bands
Ehlers Fractal Adaptive Moving Average with Bands [Bitcoinduke]FRAMA – What is it?
Fractal Adaptive Moving Average Technical Indicator ( FRAMA ) was developed by John Ehlers, code was implemented by TradingView user Shizaru. I've updated it to Pine Script 4 and added Bands Extension.
This indicator is constructed based on the algorithm of the Exponential Moving Average , in which the smoothing factor is calculated based on the current fractal dimension of the price series.
Advantages:
possibility to follow strong trend movements
determine moments of price consolidation ( FRAMA sufficiently slow down at these moments)
FRAMA + Bands
The FRAMA serves as a base for the Upper and Lower Bands which are used as a way to measure volatility by observing the relationship between the Bands and price. Typically the Upper and Lower Bands are set to two standard deviations away from the FRAMA ; however it should be adjusted depending on the task.

Cuban's Reversion BandsThere are quite a few band indicators out there, ATR, VWAP, Bollinger, Fib, etc. however, I could never find anything that could scale accurately during periods of high volatility. That brought me to writing this indicator.
These bands use my Volume-Weighted Anchored Trend (VWAT) for the basis and highlight the standard deviation that you might expect high probability reversals to occur from.
I use these bands in my own trading system. The default settings are quite effective but you're able to modify the std multiplier within the settings as you see fit.
Generally, I would only play reversals during a ranging environment, however even if the market is trending, these bands will assist in spotting a weakening trend.
An ideal trend reversal would be a wick into the outer band, followed shortly by a weaker sweep of the previous move and wicking the inner band.
Hopefully you'll find this useful in your trading!

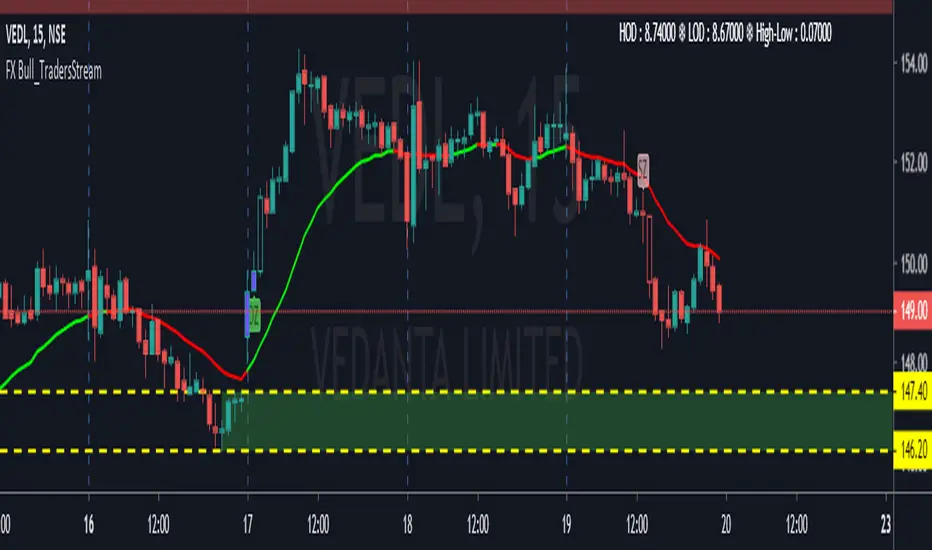
FX Bull_TradersStreamComplete Solution for Trading. In this Indicator
1. Oscillators = In that you will find EMA, SMA & Bollinger Band
2. Length = It's Length of EMA & SMA
3. Demand Zone = Wherever you find "DZ" Label and with that Trend and Location is in your favour than you can go Long from that zone. And another thing you can choose base Quantity Up to 6 Bases.
4. Supply Zone = Wherever you find "SZ" Label and with that Trend and Location is in your favour than you can go Short from that zone. And another thing you can choose base Quantity Up to 6 Bases.
5. Higher Time Frame = Choose this thing so, tool can know what is your Higher Time Frame accordingly this it will judge your ITF & LTF.
6. Higher Distal & Lower Distal = Please enter manually the no.'s of your Upper Distal Line & Lower Distal Line. and when changing chart don't forget to make it "0"
7. Trend @ ITF = Choose your Trend. (Please choose your Trend from your ITF (Intermediate Time Frame)Time frame, to get better results)
9. Risk As per DATR in % = Calculates as per DATR (Daily Average True Range)
10. 1st Symbol & 2nd Symbol = To have other symbol price in your chart.
11. Explosive Candle & Basing Candle = Tick to view Explosive & Boring candle in zone formations & Untick hide the indication.
BB-levels_MTFThis indicator draws Bollinger Bands- levels from higher timeframes on the chart's right border as a horizontal support/resistance lines. BB(20)- levels are shown from timeframes MN, 2W, 1W, 1D, 4H and 1H.
Levels are shown both for Standard Deviation 1 (dotted BB25- and BB75- lines) and STD 2 (solid BB0- and BB100- lines), as well as SMA20 (blue BB50- line).
You can choose if you want to see only the lines or the labels also. And you can modify the line's length and width, and the label's position on the screen also.

ZoneBand (@Mido_yuiya)Bollinger band is converted to EMA , and support and resistance bands are made into regions

Better Bollinger Bands (now open source)General purpose Bollinger band indicator with a number of configuration options and some additional color-coded information. The main advantages of it over standard Bollinger bands are:
1) Better statistics:
* Uses volume weighted moving averages, variance, and standard deviation by default. The volume dependence can be disabled with a checkbox option, but generally makes it more responsive improves its ability to distinguish true outlier events from random variation.
* Lets you pick between different time windows (simple, sawtooth (WMA), exponential) in addition to the volume weighting, with appropriate Bessel corrections to make the estimators unbiased and to get consistent result for different weights.
* Has a checkbox option to use a linear regression in the band calculation if you don't want average momentum to be counted in the volatility. This turns the centerline into a last squares moving average, and the band width at each time step is given by the variance away from the regression line instead of from a moving average. Weights in the least squares regression are changed according to the other options. For tickers with a strong long-term trend this makes the bands track the price action more closely.
2) Geometric
* This does all calculations on log(price) instead of the prices themselves.
* Makes almost no difference in most cases, but gives better results on charts with strongly exponential behaviour that range between several orders of magnitude.
* Properly centered around price action on log plots.
* Will never annoy you by rescaling a log plot due to a negative lower band. The lower band is always positive for positive prices.
3) Some built in oscillators.
* This aims to reduce clutter by building in some other indicators into the band color scheme. You can pick between various momentum & RSI operators to color the center line and the bands, or leave the bands plain.
I've been using these bands myself for a few months & have been gradually adding functionality & polish. Feel free to comment, or to refer to me if you borrow any ideas.

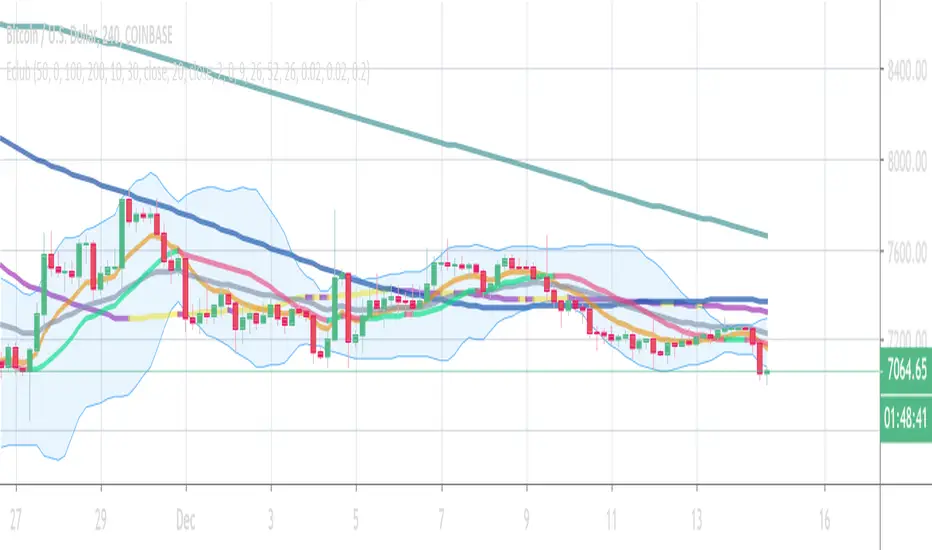
Eclub Multi IndicatorThis multi Indicator includes:
3 Moving Averages
2 Exponential Moving Averages
Bollinger Band
Ichimoku
Parabolic SAR
You can change the colors if you want. Go to setting to enable Ichimoku or SAR or disable others.
The color tolerance is by default zero which results in a very sensitive color change. You can change it to decrease the sensitivity. The value should be the last decimal of the price or the last two decimals of price etc.
If you like this indicator donate some BTC to the following address:
BTC address:
18NSD2xdJyYWoC4CSr4xg1hMk2q5cBbr8T
CBMA Bollinger Bands Strategy directed [ChuckBanger]I just did a Bollinger Bands script with my newly CB moving average
While I'm generally against posting strategies because it's very easy to fake performance numbers... This is just to share a cool strategy snippet. My settings are 10 contracts/order with pyramiding set to 10. You can make the profitability a lot higher if you set the order size higher. But that dosent help you getting more out of this script when u make a bot of this script. I set the order size to 10 contracts to get your attention not to showcase the performance.
When the price is going down and outside of the lower side of the band. And when the price comes back into the channel the strategy buys. Usually that means the price is going up. And when the price is going up and outside of the upper band. The strategy sells when it crosses back in to the channel.
It is a very simple strategy but it is effective. I guess you need a proper stop-loss for this script to bee really profitable in a bot environment.

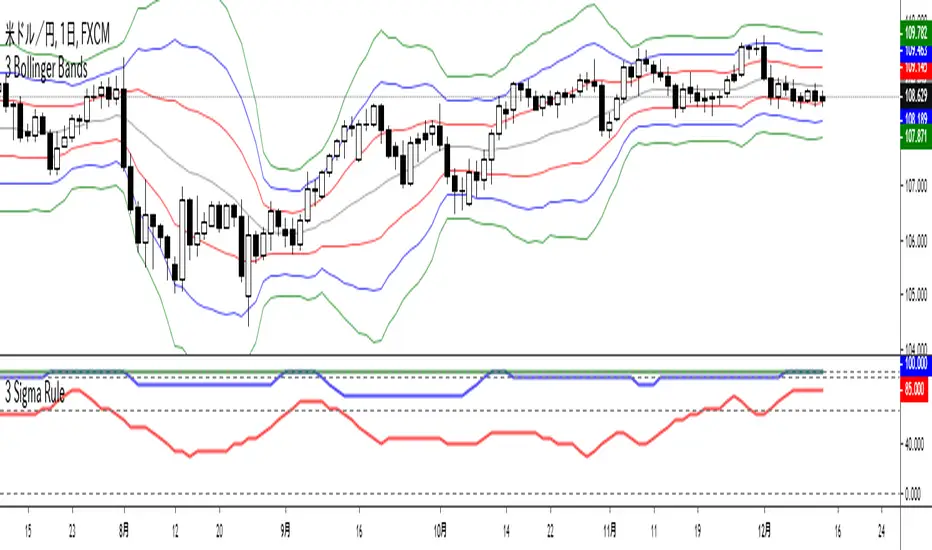
3 Sigma Rule設定した過去n日間の値動きが、どのくらいの確率で1~3σに収まっているかを表示するインジケーターです。
(From Wikipedia, the free encyclopedia)
In statistics, the 68–95–99.7 rule, also known as the empirical rule, is a shorthand used to remember the percentage of values that lie within a band around the mean in a normal distribution with a width of two, four and six standard deviations, respectively; more accurately, 68.27%, 95.45% and 99.73% of the values lie within one, two and three standard deviations of the mean, respectively.
Bollinger Bands Trend Model-BuschiEnglish
In general, Bollinger Bands are used as an indicator to visualize the "reversion to the mean". However, in this model, by using smaller variable values (default: 10 time intervals instead of 20, 1 standard deviation instead of 2), they are used as an trend following indicator. Two consecutive closes above the upper band form a buy signal (symbol 'B' above bar) which is reversed by two consecutive closes below the lower band (symbol 'S' under bar) and vice versa. The corresponding buying (green) and selling (red) zones are coloured between the bands.
Deutsch
Im Allgemeinen werden Bollinger-Bänder als ein Indikator verwendet, um die "Rückkehr zum Mittelwert" zu visualisieren. In diesem Modell werden sie durch kleine Variablen-Werte (Standardwert: 10 Zeitintervalle anstatt 20, 1 Standardabweichung anstatt 2) jedoch als Trendfolge-Indikator verwendet. Zwei aufeinanderfolgende Schlusskurse über dem oberen Band (Symbol 'B' über dem Balken) bilden ein Kaufsignal, das durch zwei aufeinanderfolgende Schlusskurse unter dem unteren Band (Symbol 'S' unter Balken) umgekehrt wird. Gleiches gilt umgekehrt. Die entsprechenden Kauf-Zonen (grün) und Verkauf-Zonen (rot) werden zwischen den Bändern eingefärbt.

Combo Backtest 123 Reversal & DAPD This is combo strategies for get a cumulative signal.
First strategy
This System was created from the Book "How I Tripled My Money In The
Futures Market" by Ulf Jensen, Page 183. This is reverse type of strategies.
The strategy buys at market, if close price is higher than the previous close
during 2 days and the meaning of 9-days Stochastic Slow Oscillator is lower than 50.
The strategy sells at market, if close price is lower than the previous close price
during 2 days and the meaning of 9-days Stochastic Fast Oscillator is higher than 50.
Second strategy
This indicator is similar to Bollinger Bands. It based on DAPD - Daily
Average Price Delta. DAPD is based upon a summation for each of the
highs (hod) for the 21 days prior to today minus the summation for
each of the lows (lod) for the last 21 days prior to today. The result
of this calculation would then be divided by 21.
It will be buy when high above previos DAPD high and sell if low below previos DAPD low
WARNING:
- For purpose educate only
- This script to change bars colors.

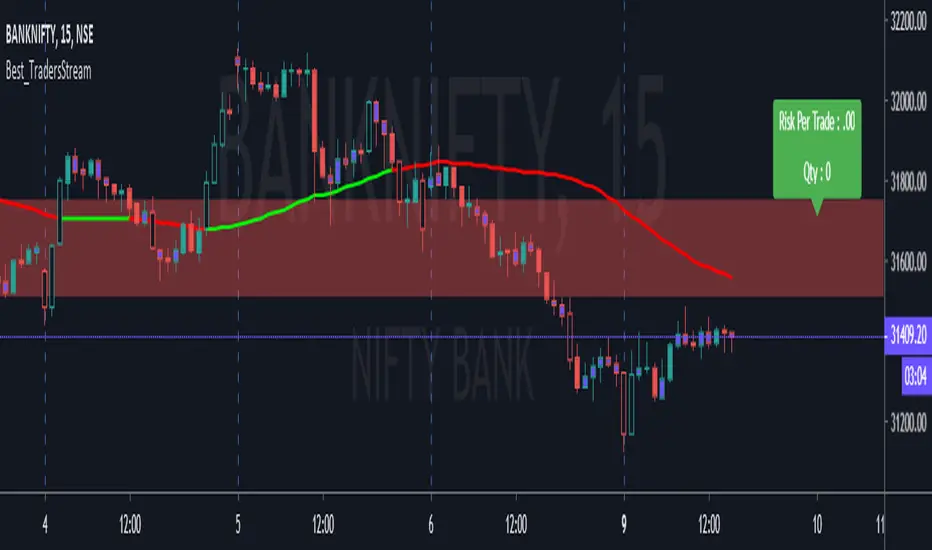
Best_TradersStreamIn this Indicator you will find SMA 50, SMA 30 and 40 Cross Over, Bollinger Band filled with Green and Red Colors and Finally Risk calculator to calculate Risk per Trade and Qty per Trade. This tool is Especially useful to Intraday Trading.
Combo Strategy 123 Reversal & DAPD This is combo strategies for get a cumulative signal.
First strategy
This System was created from the Book "How I Tripled My Money In The
Futures Market" by Ulf Jensen, Page 183. This is reverse type of strategies.
The strategy buys at market, if close price is higher than the previous close
during 2 days and the meaning of 9-days Stochastic Slow Oscillator is lower than 50.
The strategy sells at market, if close price is lower than the previous close price
during 2 days and the meaning of 9-days Stochastic Fast Oscillator is higher than 50.
Second strategy
This indicator is similar to Bollinger Bands. It based on DAPD - Daily
Average Price Delta. DAPD is based upon a summation for each of the
highs (hod) for the 21 days prior to today minus the summation for
each of the lows (lod) for the last 21 days prior to today. The result
of this calculation would then be divided by 21.
It will be buy when high above previos DAPD high and sell if low below previos DAPD low
WARNING:
- For purpose educate only
- This script to change bars colors.

Bollinger Bands on MacdOnly longs when Macd line is above Bollinger Band and shorts when Macd line is above Bollinger Band, this will avoid many problems.
thumbs up!!!

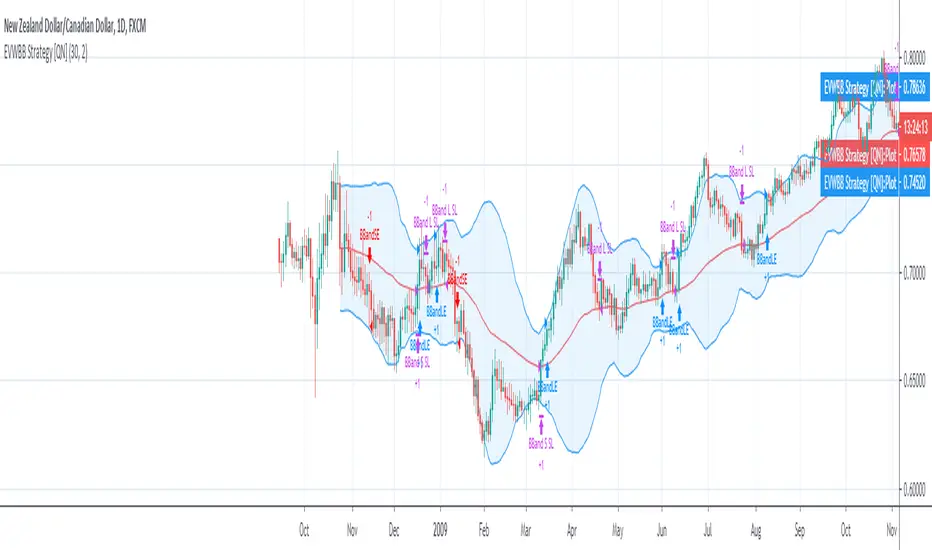
EVWBB Strategy [QuantNomad]It's my new strategy using EVWMA (Elastic Volume Weighted Moving Average).
Now I created a Bollinger Bands strategy where basis level is EVWMA.
It looks pretty interesting but you have to be careful with the entries/exits on the same bar, I'm using stop orders, so on big moves it happens pretty often.
In the next version, I will try to eliminate these issues.
Entry for this strategy happens when price crossover upper for long and lower for short. I exit both short and long on basis level.