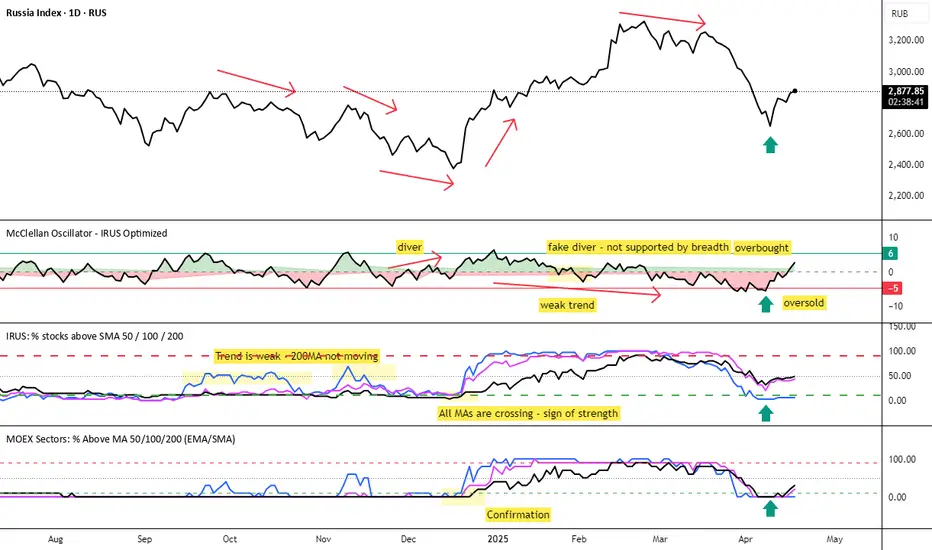
MOEX Sectors: % Above MA 50/100/200 (EMA/SMA)🧠 Name:
MOEX Sectors: % Above MA 50/100/200 (EMA/SMA)
📋 Description (for TradingView “Description” tab):
This indicator shows the percentage of Moscow Exchange sectoral indices trading above the selected moving average (SMA or EMA) with periods of 50, 100, or 200.
It uses 10 official MOEX sector indices:
MOEXOG (Oil & Gas)
MOEXCH (Chemicals)
MOEXMM (Metals & Mining)
MOEXTN (Transport)
MOEXCN (Consumer)
MOEXFN (Financials)
MOEXTL (Telecom)
MOEXEU (Utilities)
MOEXIT (IT)
MOEXRE (Real Estate)
The indicator plots up to 3 lines representing the % of sectors trading above MA 50, 100, and/or 200. The MA type is user-selectable: EMA (default) or SMA.
Horizontal reference levels (90, 50, 10) help interpret market conditions:
🔼 >90% — Overbought zone, potential market exhaustion
⚖️ ~50% — Neutral state
🔽 <10% — Oversold zone, possible rebound
📈 How to Use in Strategy:
✅ 1. Trend Filter
If >50% of sectors are above MA 200 → market in long-term uptrend
If <50% → avoid long bias, bearish regime likely
✅ 2. Bottom Detection
When <10% of sectors are above MA 200, the market is heavily oversold — often a bottoming signal
✅ 3. Trend Confirmation
If the main index is rising and % of sectors above MA is growing, the trend is supported by breadth
If the index rises while breadth declines → bearish divergence
✅ 4. Contrarian Setups
>90% of sectors above MA 50 → market may be overheated, watch for pullback
<20% above MA 50 → potential local bottom
⚙️ Tips:
Overlay this indicator on the IMOEX index chart to detect narrow leadership
Combine with other breadth metrics or RSI on the index
Use the EMA/SMA toggle to fine-tune sensitivity
مؤشرات اتساع النطاق
London Session 15-min Range – Clean AEST Timestamp Fix (w/ EMAs)London Session 15-min Range – Clean AEST Timestamp Fix (with EMAs)
What it does:
This script is made for traders who want to track the high and low of the first 15-minute candle of the London session, using AEST (UTC+10) as the time reference. It also plots the 50 EMA and 200 EMA to help identify trend direction.
How it works:
Session Timing:
The London session is defined as starting at 6:00 PM AEST.
The session ends at 2:00 AM AEST the next day.
Detects the first 15 minutes of the London session:
During this time, it records the highest and lowest price.
Draws lines once the 15-minute window is over:
A red horizontal line is drawn at the session high.
A green horizontal line is drawn at the session low.
These lines extend 50 bars into the future.
It only draws these once per day/session.
Includes EMAs:
A 50-period EMA is calculated and plotted in yellow.
A 200-period EMA is calculated and plotted in white.
Why use it:
It helps visualise important price levels from the start of the London session and pairs that with moving averages to spot trends or potential breakouts.

Supply & Demand Zones + Order Block (Pro Fusion) SuroLevel up your trading edge with this all-in-one Supply and Demand Zones + Order Block TradingView indicator, built for precision traders who focus on price action and smart money concepts.
🔍 Key Features:
Automatic detection of Supply & Demand Zones based on refined swing highs and lows
Dynamic Order Block recognition with customizable thresholds
Highlights Breakout signals with volume confirmation and trend filters
Built-in EMA 50 trend detection
Take Profit (TP1, TP2, TP3) projection levels
Clean visual labels for Demand, Supply, and OB zones
Uses smart box plotting with long extended zones for better zone visibility
🔥 Ideal for:
Traders who follow Smart Money Concepts (SMC)
Supply & Demand strategy practitioners
Breakout & Retest pattern traders
Scalpers, swing, and intraday traders using Order Flow logic
📈 Works on all markets: Forex, Crypto, Stocks, Indices
📊 Recommended timeframes: M15, H1, H4, Daily
✅ Enhance your trading strategy using this powerful zone-based script — bringing structure, clarity, and automation to your chart.
#SupplyAndDemand #OrderBlock #TradingViewScript #SmartMoney #BreakoutStrategy #TPProjection #ForexIndicator #SMC

Custom Opening Range FillThis TradingView indicator visualizes a customizable opening range. Users define the start hour, minute (UTC), and range duration. It calculates the high and low prices within this period and fills the area between them on the chart. The range resets daily. This highlights a specific trading window, aiding in identifying potential breakout or breakdown levels. Traders can adjust the time parameters to analyze various market sessions or strategies. It's useful for those focusing on price action within a defined timeframe, simplifying the observation of key price levels.

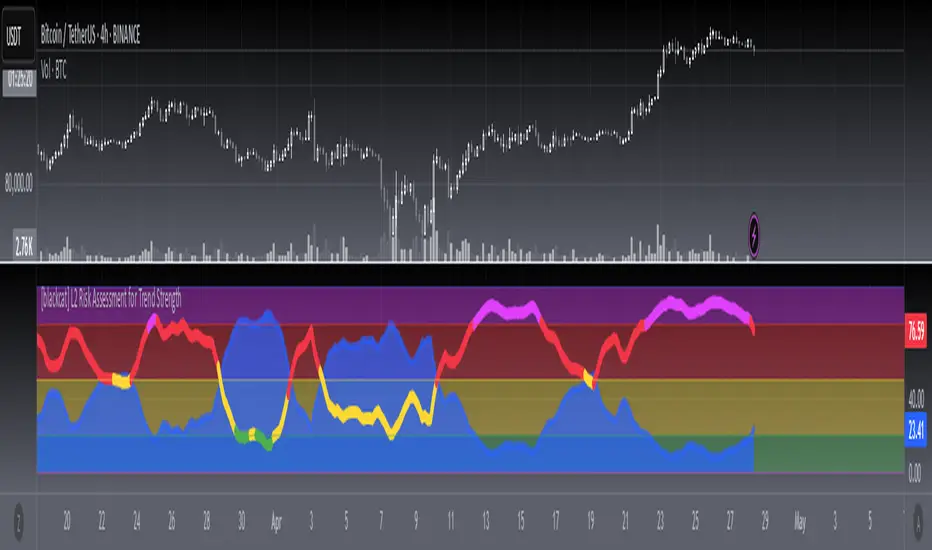
[blackcat] L2 Risk Assessment for Trend StrengthOVERVIEW
This script provides an advanced technical analysis tool combining real-time **Risk Assessment** and **Trend Strength Indicators**, displayed independently from price charts. It calculates multi-layered metrics using weighted algorithms and visualizes risk thresholds via dynamically-colored zones.
FEATURES
- Dual ** RISKA ** calculations ( RSVA1 / RSVA2 ) across 9-period cycles
- Smoothed outputs via proprietary **boldWeighted Moving Averages (WMAs)**
- Dynamic **Current Safety Level Plot** (fuchsia area-style visualization)
- Color-coded **Trend Strength Line** reacting to real-time shifts across four danger/optimism tiers
- Automated threshold validation mechanism using last-valid-value logic
- Visually distinct risk zones (blue/green/yellow/red/fuchsia) filling background areas
HOW TO USE
1. Add to your chart to observe two core elements:
- Area plot showing current risk tolerance buffer
- Thick line indicating momentum strength direction
2. Interpret values relative to vertical thresholds:
• Above 100 = Ultra-safe zone (light blue)
• 80–100 = Safe zone (green)
• 20–80 = Moderate/high-risk zones (yellow)
• Below 20 = Extreme risk (red)
3. Monitor trend confidence shifts using the colored line:
> **Blue**: Strong bullish momentum (>80%)
> **Green/Yellow**: Neutral/moderate trends (50%-80%)
> **Red**: Bearish extremes (<20%)
LIMITATIONS
• Relies heavily on prior 33-period low and 21-period high volatility patterns
• WMA smoothing introduces minor backward-looking bias
• Not optimized for intraday timeframe sub-hourly usage
• Excessive weighting parameters may amplify noise during sideways markets
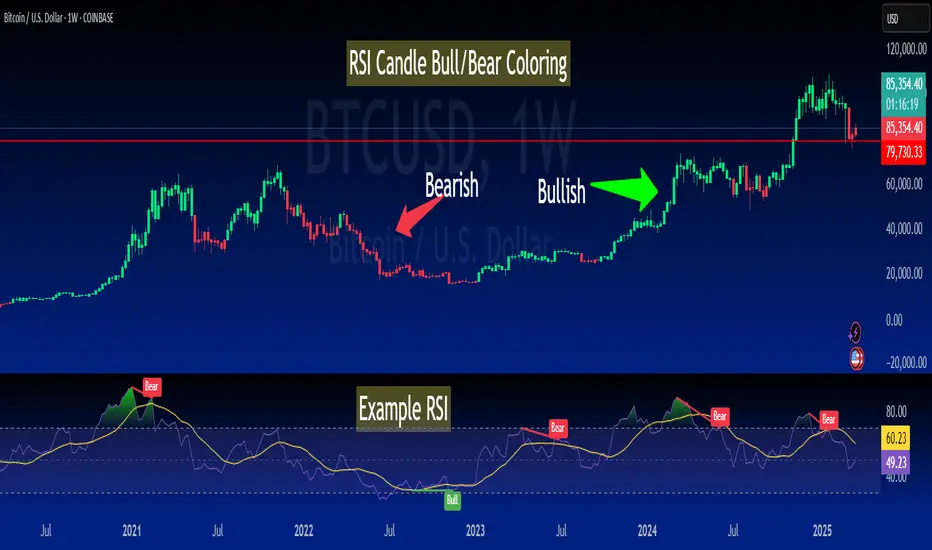
RSI-Colored Price Candles with BackgroundThis Pine Script indicator visually enhances price candles based on **RSI (Relative Strength Index)** behavior, helping traders quickly assess momentum directly on the price chart.
**RSI Calculation:**
The RSI is computed using a traditional 14-period lookback. It uses `ta.rma()` to smooth average gains and losses, and then transforms the result into an RSI value between 0 and 100. This value is used to determine both **candle color** and optional **background shading**.
**Candle Coloring:**
Each price candle is recolored based on the current RSI value:
- If RSI is **greater than or equal to 50**, the candle is **bright green**, indicating bullish momentum.
- If RSI is **less than 50**, the candle is **bright red**, indicating bearish momentum.
The actual OHLC values of the candles remain unchanged. Only their color is modified to reflect RSI strength.
**Optional Background Highlighting:**
A user setting called `Show Overbought/Oversold Background` lets traders toggle background shading on or off. When enabled:
- If RSI is **above 70**, a soft **green** background appears, signaling overbought conditions.
- If RSI is **below 30**, a soft **red** background appears, signaling oversold conditions.
This provides an intuitive visual cue that highlights potential reversal or exhaustion zones based on RSI extremes.
**Custom Settings:**
- The RSI length and source are customizable.
- Background highlighting is turned **off by default**, giving users a clean chart unless they choose to enable it.
**Purpose and Use:**
This script is designed for traders who want to visually integrate RSI momentum directly into their chart candles, reducing the need to look away from price action. It's clean, responsive, and adjustable — perfect for intraday or swing traders who value simplicity backed by momentum data.
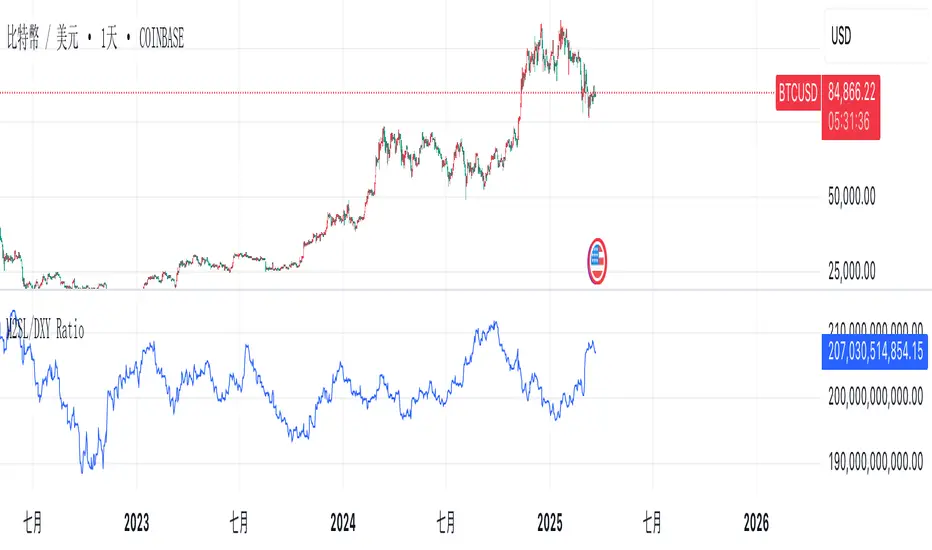
M2SL/DXY RatioThis is the ratio of M2 money supply (M2SL) to the U.S. dollar index (DXY), taking into account the impact of U.S. dollar strength and weakness on liquidity.
M2SL/DXY better represents the current impact of the United States on cryptocurrency prices.
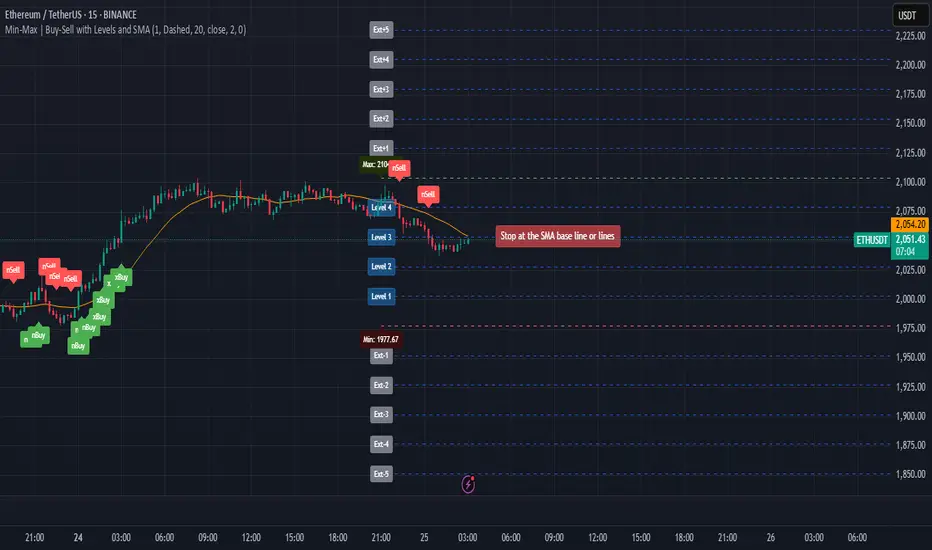
Min-Max | Buy-Sell Alert with LevelsMin-Max | Buy-Sell Alert with Levels
Description:
The Min-Max | Buy-Sell Alert with Levels indicator is a powerful tool designed to help traders identify key levels of support and resistance based on the previous day's high and low prices. It plots horizontal lines for the previous day's minimum (Min) and maximum (Max) prices, along with four intermediate levels (Stop Loss 1 to Stop Loss 4) calculated as equal percentage steps between the Min and Max.
This indicator is perfect for traders who want to:
Identify potential entry points when the price returns within the Min-Max range.
Set stop-loss levels based on the calculated intermediate levels.
Receive alerts for buy, sell, and stop-loss conditions.
Key Features:
Previous Day's Min and Max Lines:
Automatically plots the Min (red line) and Max (green line) of the previous day.
These levels act as dynamic support and resistance zones.
Intermediate Stop Loss Levels:
Calculates and plots four intermediate levels (Stop Loss 1 to Stop Loss 4) between the Min and Max.
Each level is equally spaced, representing potential stop-loss or take-profit zones.
Customizable Alerts:
Buy Alert: Triggered when the price returns within the Min-Max range after breaking below the Min.
Sell Alert: Triggered when the price returns within the Min-Max range after breaking above the Max.
Stop Loss Alerts: Triggered when the price reaches any of the four intermediate levels (Stop Loss 1 to Stop Loss 4).
Customizable Appearance:
Adjust the thickness, color, and style (solid, dashed, dotted) of the lines.
Customize the colors of the Stop Loss labels for better visualization.
Labels on the Chart:
Displays "Buy" and "Sell" labels on the chart when the respective conditions are met.
Labels for Stop Loss levels are also displayed for easy reference.
How to Use:
Add the indicator to your chart.
Customize the settings (line colors, thickness, and alert preferences) in the indicator's settings panel.
Use the Min and Max lines as dynamic support and resistance levels.
Monitor the intermediate levels (Stop Loss 1 to Stop Loss 4) for potential stop-loss or take-profit zones.
Set up alerts for Buy, Sell, and Stop Loss conditions to stay informed about key price movements.
Why Use This Indicator?
Simple and Effective: Focuses on the most important levels from the previous day.
Customizable: Tailor the indicator to match your trading style and preferences.
Alerts: Never miss a trading opportunity with customizable alerts for key conditions.
Settings:
Line Thickness: Adjust the thickness of the Min, Max, and intermediate lines.
Line Colors: Customize the colors of the Min, Max, and intermediate lines.
Line Style: Choose between solid, dashed, or dotted lines.
Stop Loss Label Colors: Customize the colors of the Stop Loss labels.
Alerts: Enable or disable alerts for Buy, Sell, and Stop Loss conditions.
Ideal For:
Day traders and swing traders.
Traders who rely on support and resistance levels.
Anyone looking for a clear and customizable tool to identify key price levels.
Disclaimer:
This indicator is for educational and informational purposes only. It does not constitute financial advice. Always conduct your own analysis and trade responsibly.
Get Started Today!
Add the Min-Max | Buy-Sell Alert with Levels indicator to your chart and take your trading to the next level. Customize it to fit your strategy and never miss a key trading opportunity again!
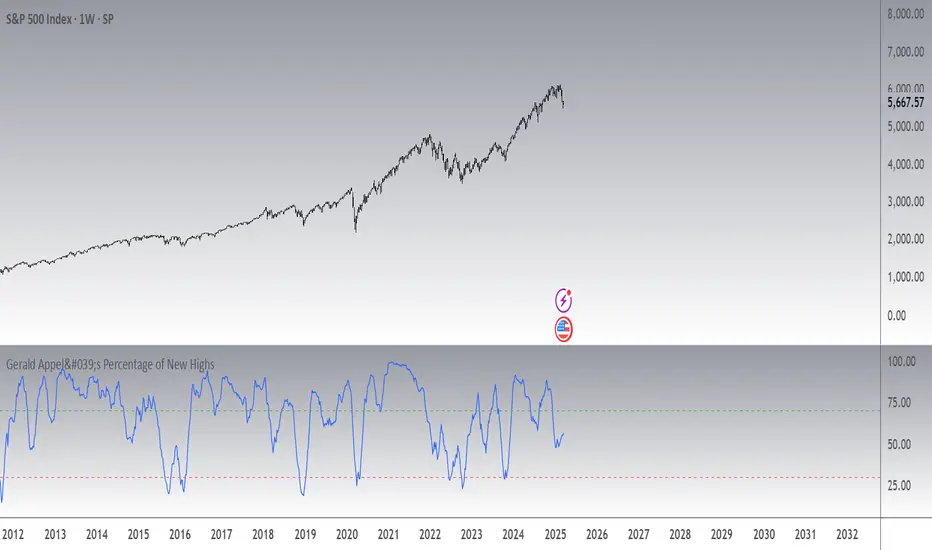
Gerald Appel's Percentage of New HighsThis is the original Gerald Appel's Percentage of new High Indicator.
10 day moving avg. of new highs divided by the total of highs plus lows. This ratio gives a good job at identifying both when a rally is weakening (when indicator breaks below from above 70%) as well as good spots to identifying spots to buy bottoms. (When Indicator moves back up through 30% from below)
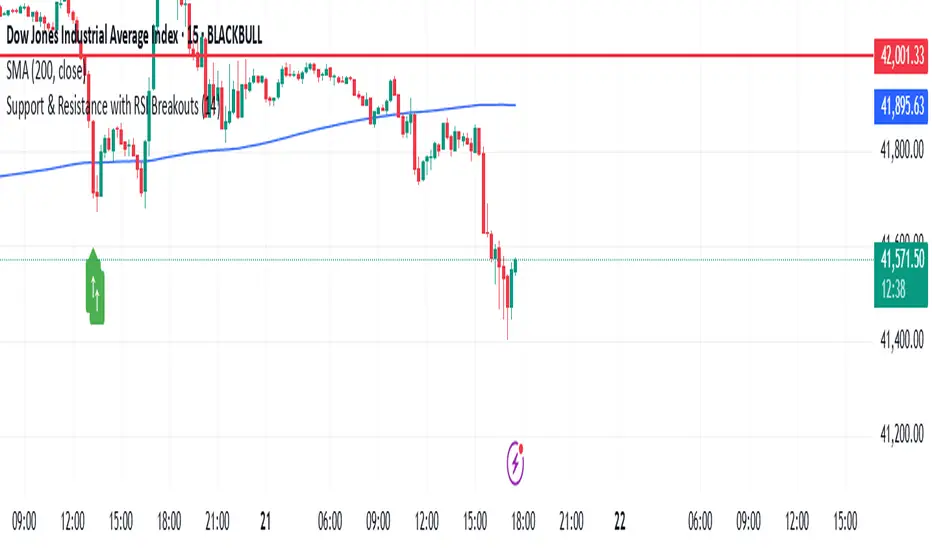
Support & Resistance with RSI BreakoutsThe script is a TradingView Pine Script (v5) indicator that identifies support and resistance levels using RSI (Relative Strength Index) breakouts. Here’s a breakdown of what it does:
Features:
RSI Calculation:
The script calculates the 14-period RSI (default) using the closing price.
The user can modify the RSI period through an input setting.
Buy and Sell Signals:
A buy signal is triggered when RSI drops below 20 (indicating oversold conditions).
A sell signal is triggered when RSI rises above 80 (indicating overbought conditions).
Visual Representation:
Buy signals are marked with a green upward arrow (↑) below the price bars.
Sell signals are marked with a red downward arrow (↓) above the price bars.
The arrows help traders easily spot potential trade opportunities.
Usage:
This script is useful for traders looking to buy at oversold conditions and sell at overbought conditions based on RSI.
It works best when combined with other indicators or price action strategies to confirm signals.
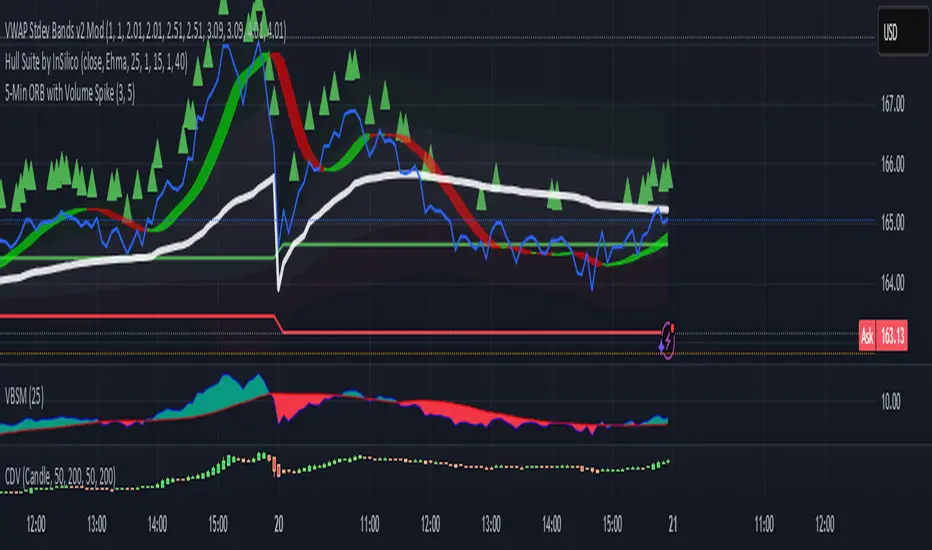
5-Min ORB with Volume SpikeThis indicator identifies Opening Range Breakouts (ORB) based on the high and low of the first 5 minutes of the trading day and confirms the breakout with a volume spike.
🔍 What It Does:
Automatically captures the Opening Range High and Low from 9:30 AM to 9:35 AM (configurable).
Plots green (high) and red (low) lines across the chart once the opening range is set.
Highlights long breakout signals when price breaks above the OR High with above-average volume.
Highlights short breakout signals when price breaks below the OR Low with above-average volume.
Volume confirmation is based on a customizable 20-period simple moving average (SMA) of volume.
⚙️ Best Used On:
5-minute or lower intraday charts (e.g., SPY, QQQ, futures, etc.)
Highly liquid, high-volatility instruments
U.S. equity market open (customizable for other sessions)
📈 Trading Edge: This strategy helps traders identify strong, momentum-driven breakouts early in the trading session — especially when confirmed by increased institutional activity (volume spike).
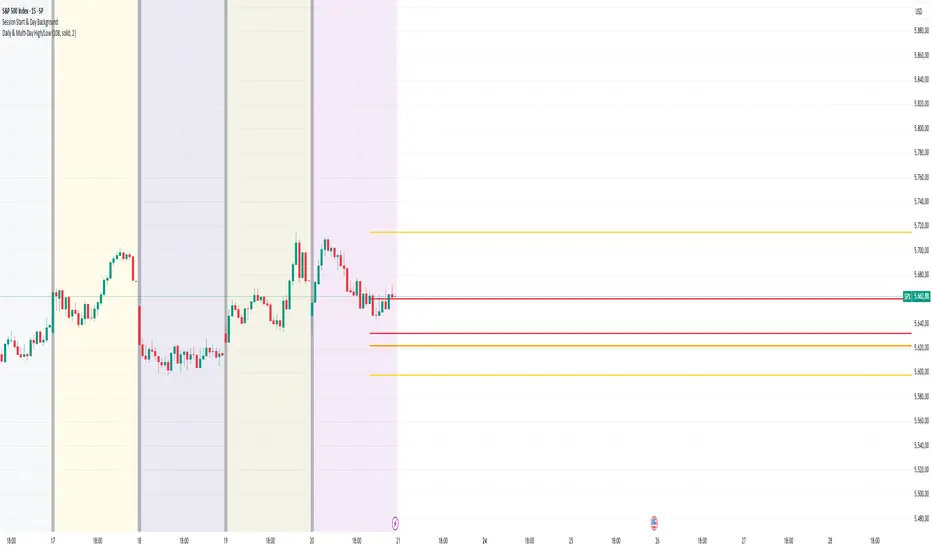
Daily & Multi-Day High/LowDaily & Multi-Candle High/Low Indicator
This indicator clearly highlights essential price levels directly on your chart, significantly improving your trading decisions:
First Candle High/Low (Session Open):
Quickly identify the high and low of the first candle each trading day, ideal for session-open traders.
Previous Day's High/Low:
Automatically plots the highest and lowest prices from the previous trading day, crucial for daily breakout or reversal strategies.
Multi-Candle High/Low (Customizable Period):
Easily track the highest and lowest points of the last X candles (default: 108 candles). Perfect for spotting key support and resistance zones.
Customization Options:
Adjust colors, line styles (solid, dashed, dotted), and line thickness directly from the settings for personalized visibility.
Ideal for day traders, swing traders, and price-action traders looking for clear and actionable daily levels on their charts.
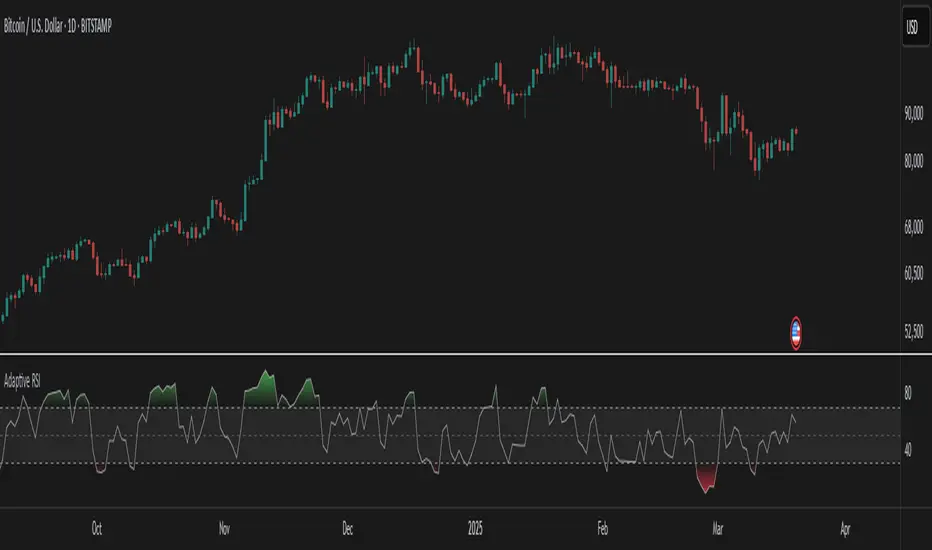
Ehlers Adaptive RSIThe Ehlers Adaptive RSI improves on the traditional RSI by dynamically adjusting its period based on market conditions.
Problem with the Classic RSI:
The traditional Relative Strength Index (RSI) uses a fixed period (e.g., 14), making it slow to react in volatile markets and too sensitive in stable conditions.
How the Adaptive RSI Solves This:
Instead of a fixed period, this version automatically adapts based on market volatility using a combination of ATR (Average True Range) and EMA (Exponential Moving Average).
Key Benefits:
More Responsive – Quickly adapts to market shifts, reducing lag.
Less Noise – Filters out unnecessary fluctuations in stable trends.
Self-Adjusting – No need to manually change RSI settings for different market conditions.
Better Signal Accuracy – Helps detect real trend reversals without false alarms.
This script is for informational and educational purposes only. It does not constitute financial advice, and past performance does not guarantee future results. Use it at your own risk.
Support and Resistance LevelsSupport and Resistance Levels with Breaks – Amin & Taufik
The Support and Resistance Levels with Breaks indicator is designed to automatically detect support and resistance levels based on pivots (high and low points within a given period). It also highlights breakouts of these levels, confirmed by increased volume for additional validation.
Key Features:
✅ Automatic Support & Resistance Detection
Uses pivothigh and pivotlow to identify key support and resistance levels.
Red lines indicate resistance, while blue lines represent support.
✅ Breakout Confirmation with Volume
The indicator generates breakout signals when price breaks support or resistance with high volume.
A downside breakout is marked with a red "B" label above the candlestick.
An upside breakout is marked with a green "B" label below the candlestick.
✅ Bullish & Bearish Wick Detection (Rejections)
Additional signals for long wicks (candlestick shadows) indicating possible price reversals.
Bullish Wick (rejection at support) is marked with a green label.
Bearish Wick (rejection at resistance) is marked with a red label.
✅ Automatic Breakout Alerts
The indicator can send automatic notifications when support or resistance is broken with high volume.
How to Use:
1️⃣ Adjust the Left Bars and Right Bars parameters to fine-tune pivot sensitivity for detecting support & resistance.
2️⃣ Enable the Show Breaks option to see breakout confirmations with high volume.
3️⃣ Use this indicator alongside price action analysis and other indicators to confirm trade decisions.
🚀 Ideal for:
✔️ Scalping & Intraday Trading
✔️ Swing Trading & Trend Following
✔️ Breakout & Retest Confirmation
ℹ️ Note:
This indicator does not provide direct buy or sell signals. It is recommended to use it alongside other technical analysis tools, such as candlestick patterns, moving averages, and RSI, for more accurate decision-making.
📌 Developed by: Amin & Taufik
🔗 License: Attribution-NonCommercial-ShareAlike 4.0 (CC BY-NC-SA 4.0)
💬 If you find this indicator useful, don’t forget to like and comment on TradingView! 🚀

Mswing HommaThe Mswing is a momentum oscillator that calculates the rate of price change over 20 and 50 periods (days/weeks). Apart from quantifying momentum, it can be used for assessing relative strength, sectoral rotation & entry/exit signals.
Quantifying Momentum Strength
The Mswing's relationship with its EMA (e.g., 5-period or 9-period) is used for momentum analysis:
• M Swing >0 and Above EMA: Momentum is positive and accelerating (ideal for entries).
• M Swing >0 and Below EMA: Momentum is positive but decelerating (caution).
• M Swing <0 and Above EMA: Momentum is negative but improving (watch for reversals).
• M Swing <0 and Below EMA: Momentum is negative and worsening (exit or avoid).
Relative Strength Scanning (M Score)
Sort stocks by their M Swing using TradingView’s Pine scanner.
Compare the Mswing scores of indices/sectors to allocate capital to stronger groups (e.g., renewables vs. traditional energy).
Stocks with strong Mswing scores tend to outperform during bullish phases, while weak ones collapse faster in downtrends.
Entry and Exit Signals
Entry: Buy when Mswing crosses above 0 + price breaks key moving averages (50-day SMA). Use Mswing >0 to confirm valid breakouts. Buy dips when Mswing holds above EMA during retracements.
Exit: Mswing can be used for exiting a stock in 2 ways:
• Sell in Strength: Mswing >4 (overbought).
• Sell in Weakness: Mswing <0 + price below 50-day SMA.
Multi-Timeframe Analysis
• Daily: For swing trades.
• Weekly: For trend confirmation.
• Monthly: For long-term portfolio adjustments.

FOMO Indicator - % of Stocks Above 5-Day AvgThe FOMO Indicator plots the breadth indicators NCFD and S5FD below the price chart, representing the percentage of stocks in the Nasdaq Composite (NCFD) or S&P 500 (S5FD) trading above their respective 5-day moving averages.
This indicator identifies short-term market sentiment and investor positioning. When over 85% of stocks exceed their 5-day averages, it signals widespread buying pressure and potential FOMO (Fear Of Missing Out) among investors. Conversely, levels below 15% may indicate oversold conditions. By analyzing these breadth metrics over a short time window, the FOMO Indicator helps traders gauge shifts in investor sentiment and positioning.

Absolute Rate Of Changeabsolute value of ROC indicator. helpful for determining if the momentum is accelerating in regardless of direction

High and Low in a Given Date/Time RangeThis Pine Script v5 indicator plots horizontal lines at both the highest and lowest price levels reached within a user-defined date/time range.
Description:
Inputs:
The user specifies a start and an end date/time by providing the year, month, day, hour, and minute for each. These inputs are converted into timestamps based on the chart’s timezone.
How It Works:
Timestamp Conversion: The script converts the provided start and end dates/times into timestamps using the chart’s timezone.
Bar Check: It examines every bar and checks if the bar’s timestamp falls between the start and end timestamps.
Price Updates:
If a bar’s time is within the specified range, the indicator updates the highest price if the current bar's high exceeds the previously recorded high, and it updates the lowest price if the current bar's low is lower than the previously recorded low.
Drawing Lines:
A red horizontal line is drawn at the highest price, and a green horizontal line is drawn at the lowest price. Both lines start from the first bar in the range and extend dynamically to the current bar, updating as new high or low values are reached.
End of Range: Once a bar's time exceeds the end timestamp, the lines stop updating.
This tool offers a clear and straightforward way to monitor key price levels during a defined period without any extra fluff.

Cumulative Weighted Change (Session) with 14 MAThis indicator provides the session weighted cumulative change of the Magnificent 7(AAPL META GOOG AMZN MSFT NVDA TSLA), it is weighted according to their market capitalization and size in relation to size of the market. The bar to bar current change is plotted by the fast line that begins its calculations at the start of each daily session, the smoother(slower) line is the 14 period Volume Weighted Moving Average of the cumulative change.
I use this in conjunction with a timeframe continuity indicator in order to weed out invalid signals, I have one that I have recently published. I use this to trade futures and index stock options, since the 7 tickers that this indicator is built off of are the biggest force that moves markets this ends up acting as an alpha indicator if you can find a consistent and reliable way to weed out false signals.
Happy Trading!
-Drgzzz

On Balance VolumeThe traditional OBV (On-Balance Volume) indicator line chart has been replaced with a candlestick-based OBV chart, offering a more granular and visually comprehensive approach to volume-price analysis. This transformation allows traders to analyze OBV fluctuations in the form of candlestick patterns, making it easier to identify critical price action signals such as support and resistance levels, breakouts, and breakdowns.
By integrating OBV candlesticks with the price chart, traders can better assess volume accumulation and distribution phases, detect divergences, and confirm trend strength. This enhanced visualization helps in identifying momentum shifts, liquidity imbalances, and institutional activity with greater accuracy. The OBV candlestick chart provides a deeper layer of market structure analysis, allowing price action traders to refine their strategies and improve trade execution based on real-time volume dynamics."

Pipstocrat Market Participant AnalysisPipstocrat Market Participant Analysis (PMPA) , analyzes the behavior of different types of traders in the market: Hot Money (short-term traders), Smart Money (institutional or professional traders), and Retail Traders . It uses RSI-based calculations to measure their activity and displays the results as colored bars on a chart.
Customizable Colors: Users can change the colors for each type of trader and other visual elements like reference lines.
Reference Lines: Horizontal lines at levels 5 (Support), 10 (Neutral), and 15 (Resistance) help interpret the data.
Focus on RSI: The script simplifies analysis by focusing solely on RSI-based signals.
This tool helps traders quickly identify trends and sentiment in the market, making it easier to spot potential opportunities.

PVSRA Volume Suite with Volume DeltaPVSRA Volume Suite with Volume Delta
🔹 Overview
This indicator is a Volume Suite that enhances PVSRA (Price, Volume, Support, Resistance Analysis) by incorporating Volume Delta and AI-driven predictive alerts. It is designed to help traders analyze volume pressure, market trends, and price movements with color-coded visualizations.
📌 Key Features
PVSRA Volume Color Coding – Highlights vector candles based on extreme volume/spread conditions.
Volume Delta Analysis – Tracks buying/selling pressure using up/down volume data.
AI-Powered Predictive Alerts – Identifies potential trend shifts based on volume and trend context.
Volatility-Adjusted Thresholds – Dynamically adapts volume conditions based on ATR (Average True Range).
Customizable MA & Symbol Overrides – Allows traders to tweak settings for personalized market insights.
Debug & Diagnostic Labels – Shows statistical z-scores, thresholds, and volume dynamics.
How It Works
PVSRA Color Coding – The script classifies candles into four categories based on volume and spread analysis:
🔴 Red Vector → Extreme bearish volume/spread
🟢 Green Vector → Extreme bullish volume/spread
🟣 Violet Vector → Above-average bearish volume
🔵 Blue Vector → Above-average bullish volume
Volume Delta Calculation – Uses lower timeframe volume analysis to estimate up/down volume differentials.
Trend & Predictive Alerts – Combines EMA crossovers with statistical volume analysis to detect potential trend shifts.
Volatility Adaptation – Adjusts volume thresholds based on ATR, making signals more reliable in changing market conditions.
Custom Symbol Override – Fetches PVSRA data from a different instrument, useful for index-based volume analysis.
Customizable Inputs
PVSRA Color Settings – Modify candle color schemes for better visual clarity.
Volume Delta Colors – Customize delta volume body, wick, and border colors.
AI Settings – Tune z-score thresholds, lookback periods, and enable predictive alerts.
Symbol Overrides – Analyze volume from a different market or asset.
Moving Average (MA) Settings – Display a volume-based moving average for trend confirmation.
Important Notes
Works best on intraday timeframes where volume data is reliable.
Lower timeframe volume delta estimates might not be precise for all assets.
No guarantees of accuracy – Use alongside other confluence tools for decision-making.
Credits & Open-Source Notice
This script is based on PVSRA methodologies and integrates Volume Delta analysis. Special thanks to Traders Reality and TradingView for their contributions to volume-based analysis.

Pivot Point Calculator PPC V2 by [KhedrFx]📈 Trade Smarter with the Pivot Point Calculator (PPC) by KhedrFx
Want to spot key price levels and make better trading decisions? The Pivot Point Calculator (PPC) by KhedrFx is your go-to TradingView tool for identifying potential support and resistance zones. Whether you’re a Scalper trader, day trader, swing trader, or long-term investor, this script helps you plan precise entries and exits with confidence.
🔹 How to Use Pivot Points in Trading
📊 Step 1: Identify Key Levels
The PPC automatically plots:
Pivot Point (P): The main level where sentiment shifts between bullish and bearish.
Support Levels (S1, S2, S3): Areas where price may bounce higher.
Resistance Levels (R1, R2, R3): Areas where price may face selling pressure.
These levels act as dynamic price zones, helping you anticipate potential market movements.
🔥 Step 2: Choose Your Trading Strategy
1️⃣ Breakout Trading
Buy when the price breaks above the pivot point (P) with strong momentum.
Sell when the price drops below the pivot point (P) with strong momentum.
Use R1, R2, or R3 as profit targets in an uptrend and S1, S2, or S3 in a downtrend.
2️⃣ Reversal (Bounce) Trading
Buy when the price pulls back to S1, S2, or S3 and shows bullish confirmation (e.g., candlestick patterns like a bullish engulfing or hammer).
Sell when the price rallies to R1, R2, or R3 and shows bearish confirmation (e.g., rejection wicks or a bearish engulfing pattern).
🎯 Step 3: Set Smart Stop-Loss & Take-Profit Levels
Stop-Loss: Place it slightly below support (for buy trades) or above resistance (for sell trades).
Take-Profit: Use the next pivot level as a target.
Extreme Zones: R3 and S3 often signal strong reversals or breakouts—watch them closely!
🚀 How to Get Started
1️⃣ Add the PPC script to your TradingView chart.
2️⃣ Choose a timeframe that fits your strategy (5m, 15m, 30m, 1H, 4H, Daily, or Weekly).
3️⃣ Use the pivot points and support/resistance levels to fine-tune your trade entries, exits, and risk management.
⚠️ Trade Responsibly
This tool helps you analyze the market, but it’s not a guarantee of profits. Always do your own research, manage risk, and trade with caution.
💡 Ready to take your trading to the next level? Try the Pivot Point Calculator (PPC) by KhedrFx and start trading with confidence today! 🚀
