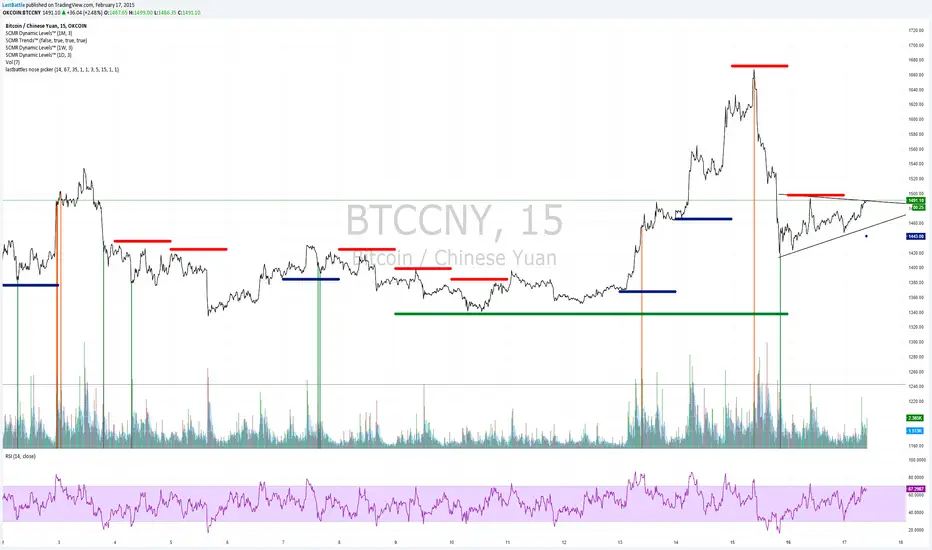
[Bitcoin] Lastbattle's nose pickerI've been working on a top and bottom picker script over the past couple of weeks, based on RSI of multiple timeframe closing price. It've been a pretty good trading system that's tested over the last meteoric rise from 220~270 and back down to 230 right now, and I think it should be released to the community.
Sure, I'm not worried about this strategy not working anymore after it is being used by the majority. Everyone have a different view of the market, and this is more towards psychology. It'll likely to hold for as long as there are still humans trading Bitcoins. Bitcoin market is full of emotions, you'll never run out of it.
So why does it work?
If you take a look at the live charts offered by Bitcoinwisdom and Cryptowatch, they only offer 1, 3, 5, and 15 minute timeframe by default with no other option to switch.
Naturally more traders will look at these levels for oversold and overbought condition.
The same indicator does not work for the broader commodities market such as Gold and Silver.
How does it work?
As long as the RSI levels of 1, 3, 5, and 15 minute fulfills the oversold/overbought level, a signal will be given.
The overbought/oversold level gets compensated the higher volatility the market is in.
Note: **
-This is only for exit strategy. If you're on long, consider reducing or exiting your position when it displays a red. On the other hand if you're short, consider reducing or covering your shorts if it shows a green.
-It may give false signal in a trending market, use your trading experience and judgement to filter them out. (eg: uptrend usually have more than 1 legs AND after a long consolidation, RSI gets to oversold/overbought easily... the market will tend to test the support/resistance again.)
-This is tuned for the 15m interval, the script won't work beyond this. I use it for scalping futures. Feel free to change or remove this line 'plot(interval == 15 and '
-Even if it shows a signal, it may not be the true top/bottom. Sometimes there may be a weak diverged leg aka 'last fart', so that's one reason I dont use this for entry until more confirmation is given via other indicators.
** If your chart is zooming all the way down to 0, right click on the price at the right and select 'Scale price only'
Go ahead and try this out with willy, etc and see what works better :D
Credits:
-LazyBear for the volatility switcher script