BTCUSD

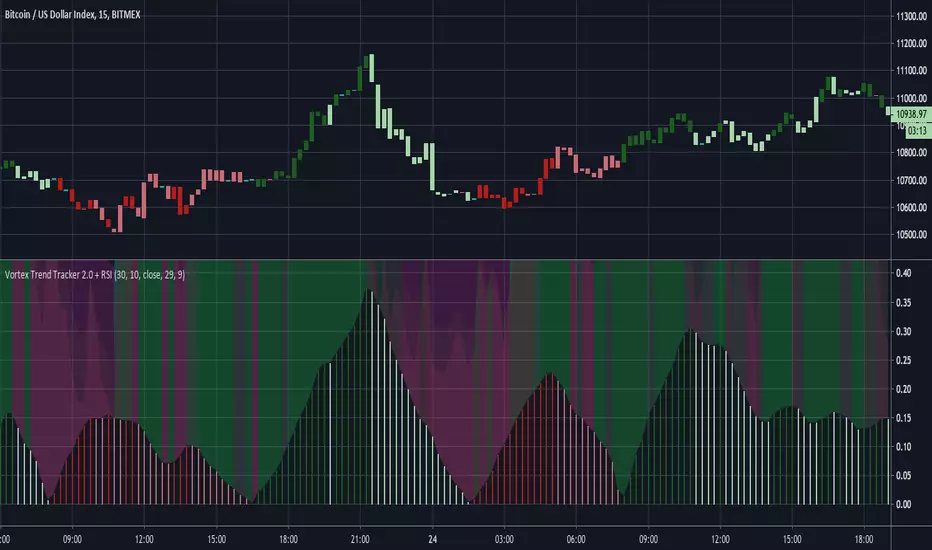
Vortex Trend Tracker 2.0 + RSIHere's an updated version of our Vortex Trend Tracker indicator.
Here's the link to the original if anyone wants to read more about the Vortex or see the first version:
We've added in 4 rsi's of varying lengths for this second version(2 fast and 2 slow) that create the background color effect.
Triple Coppock CurveThe Coppock Curve is a zero-centered momentum oscillator that relies primarily on rate of change calculations. The Coppock Curve in its most basic form is already a great indicator, especially for spotting shifts in momentum. But, we wanted to see how we could modify it to get some better performance out of it.
As the ‘cop’ function demonstrates, the Coppock Curve has a pretty simple calculation. The first step is to calculate the rate of change at a longer and shorter window length. Next, the sum of the two rate of change values is calculated and finally a weighted moving average of a user defined length is calculated(this is the Coppock Curve).
The ‘cop()’ function set the foundation to allow us to implement our modifications. As you can see in the graph, there are 3 different lines (2 histogram and 1 normal line) comprising the Coppock values based on the rate of change of high, low, and closing prices. We liked this layout because it allows traders to easily identify the curve’s pivots and the balance of negative vs. positive momentum.
The Coppock Curve based on high prices is plotted as the teal histogram, wile the pink histogram represents the Coppock Curve of low prices. The curve based on closing prices is the red and green alternating line plotted on top of the two histograms.
We included some notes on the chart to help with interpreting the three curves.
There are two common approaches traders can take when trading with the indicator:
1. Trade based on closing price curve: Go long when line changes from bearish(red) to bullish(green). Then, go short when same line changes from bullish to bearish.
2. Trade based on crossings of the zero-line. This could be based on the high, low, or closing price curves, but closing price is the safest bet. So, go long when it crosses from negative into positive territory and short when it crosses under the zero line from positive into negative territory.

Ppsignal GSV V1Entry pattern GSV (Greatest Swing Value)
We return with another Larry Williams pattern, the Greatest Swing Value or GSV, in principle this pattern was developed for the S & P 500, but it could be extrapolated to other markets, as with the previous pattern we will only explain it for long positions. First of all we have calculated the difference between the maximum and the opening of the last 4 bars and its average, that is to say: /4. Being H the maximum of each bar and the O the opening price of each bar. From this average we will extract 180%, that is, we will multiply it by 1.8. The value of this result will be the GSV.
The logic of this GSV entry pattern is as follows: a widely used way to enter the markets is the breaking of highs, but many times false breakdowns occur or what Larry Williams calls "failure swings", to avoid these false ruptures Larry invented the GSV, which is like a moving average applied to the Swing Value (the difference between the maximum and the opening price).
Once we have the GSV we must add it to the opening price of the current bar and the entry will occur when the price exceeds this level.
to determine the entrance we use bollinguer band and atr. In this way we enter the pattern with volatility.
Patrón de entrada GSV (Greatest Swing Value)
Para esta tecnica usamos la volatilidad para determinar entradas, bollinguer band 13.1 y atr...
Volvemos con otro patrón de Larry Williams, el Greatest Swing Value o GSV, en principio estepatrón fue desarrollado para el S&P 500, pero se podría extrapolar a otros mercados, al igual que con el patrón anterior solamente lo explicaremos para posiciones largas. Primero de todo hemos calculado la diferencia entre el máximo y la apertura de las 4 últimas barras y hacersu media, es decir: /4. Siendo H el máximo de cada barra y la O el precio de apertura de cada barra. De esta media sacaremos el 180%, es decir, lo multiplicaremos por 1.8. El valor de este resultado será el GSV.
La lógica de este patrón de entrada GSV es la siguiente: una forma bastante usada para entraren los mercados es la ruptura de máximos, pero muchas veces se producen rupturas falsas o loque Larry Williams llama "failure swings", para evitar estas rupturas falsas Larry inventó el GSV,que es como una media móvil aplicada al Swing Value (la diferencia entre el máximo y el preciode apertura).
Una vez tenemos el GSV deberemos sumárselo al precio de apertura de la barra actual y la entrada se producirá cuando el precio supere este nivel.
para determinar la entrada usamos bollinguer band y atr. des esta manera entramos al patron con volatilidad.

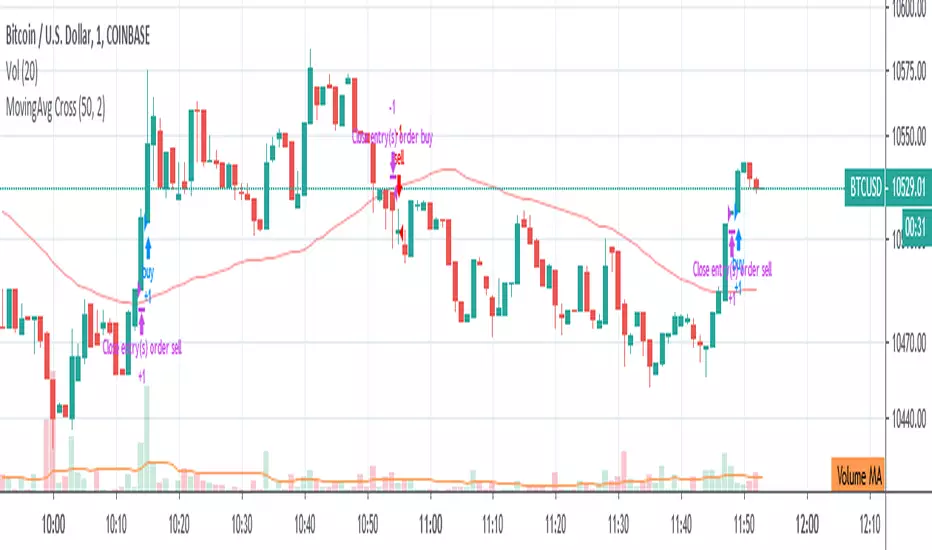
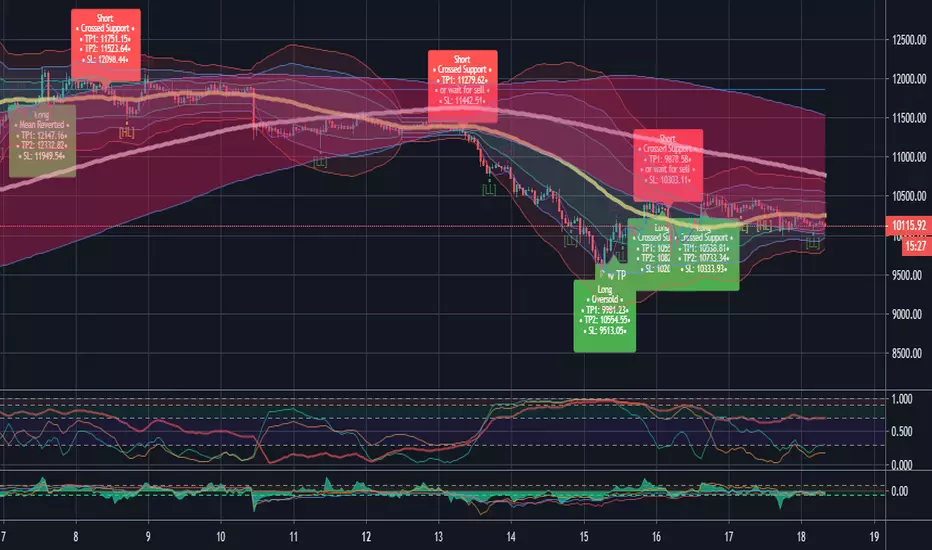
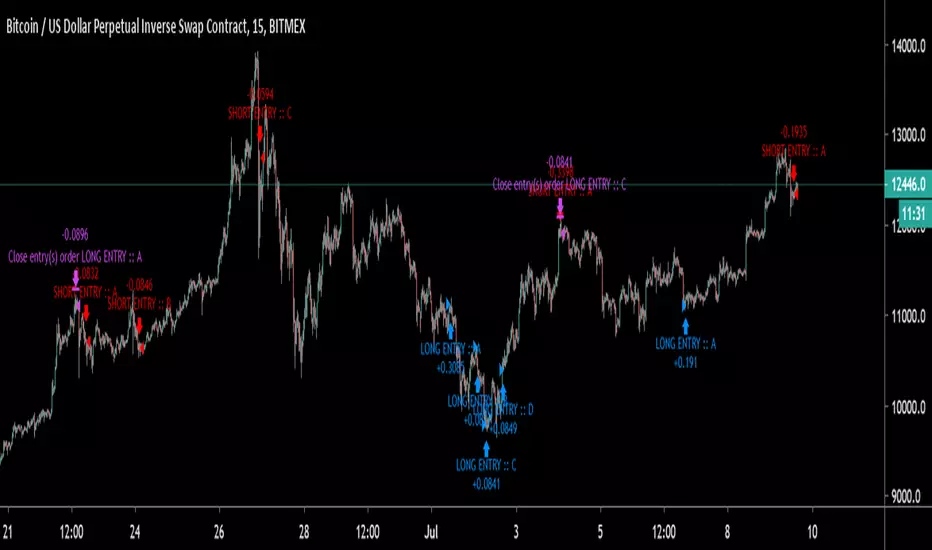
PpSignal LONG SHORT BTC SIGNALanalyzing the open buy or sell positions, we have developed an indicator that avoids falling into trading traps
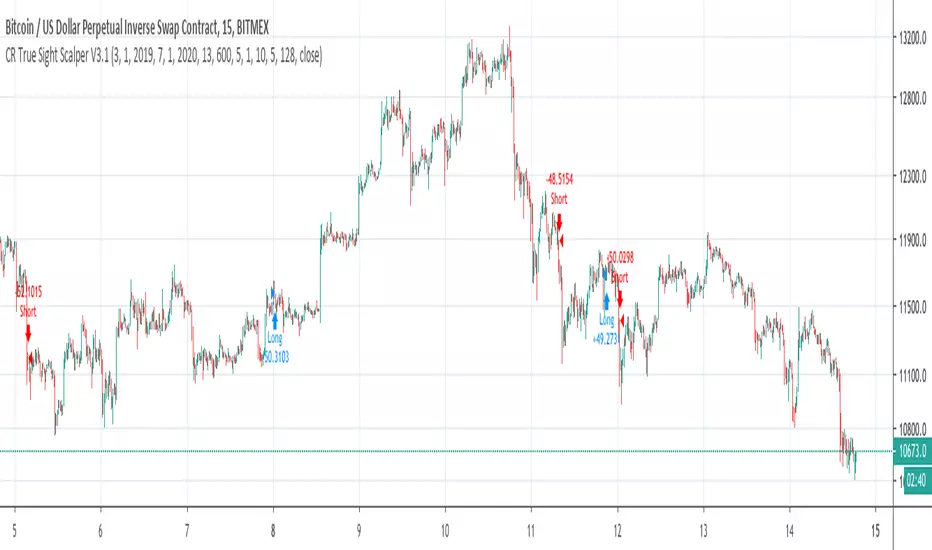
CR True Sight Scalper V3.1True Sight Scalper V3.1 is an incompatible update to V3.0, with much smaller losses.
$100,000 Initial capital.
From 2019-04-04 to 2019-07-14
Odin - Bitmex EasymodeThree years ago we started a journey to building a trading framework that was intended to design a framework to stop trading time for money. Today I'm releasing the first version of that hard work as a simple, buy sell indicator optimised for crypto, but can be applied to almost any market.
This indicator was designed as a starting framework for new traders who are unsure of market trends and market movements when entering leveraged trading. Future releases will be coming soon that will include Take profit and stop loss targets and colouring candles with trend, as well as trend lines .
Odin is best used as a swing trader looking to find your peaks and bottoms when we have large shifts in trend. The indicator comes with several options including:
Turning on more signals for riskier trades.
Adjusting the aggressiveness of the algorithm.
Turn on lower lows and highs and higher highs and lows.
Persistence factor to find and counter trade certain trends early.
If you would like to learn more about Odin and whats going on behind the scenes you are welcome to join us.
Bitcoin Prices InfoPanelHello traders
This script is based on the great Ricardo Santos InfoPanel script
It will display all the Bitcoin prices
The script is public so you can adjust according to your own needs
PS
You might have to scroll right on your chart to see the panel
Enjoy :)
Dave

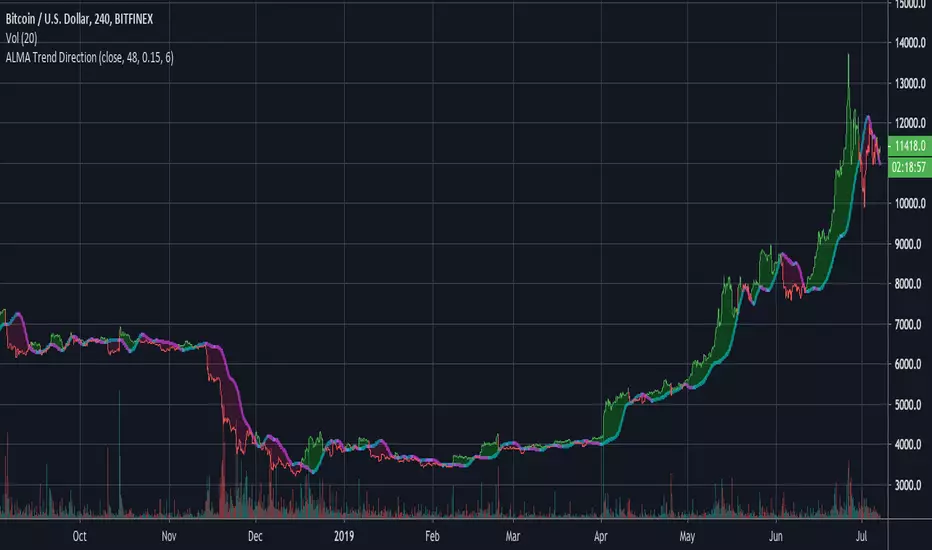
ALMA Trend DirectionHere is a very simple tool that uses the Arnaud Legoux Moving Average(ALMA). The ALMA is based on a normal distribution and is a reliable moving average due to its ability to reduce lag while still keeping a high degree of smoothness.
Input Options:
-Offset : Value in range {0,1} that adjusts the curve of the Gaussian Distribution. A higher value will result in higher responsiveness but lower smoothness. A lower value will mean higher smoothness but less responsiveness.
-Length : The lookback window for the ALMA calculation.
-Sigma : Defines the sharpe of the curve coefficients.
I find that this indicator is best used with a longer length and a 4 Hour timeframe. Overall, its purpose is to help identify the direction of a trend and determine whether a security is in an uptrend or a downtrend. For this purpose, it is best to use a lower offset value since we are looking to identify long-term, significant price movement rather than small fluctuations.
The Chart:
The ALMA is plotted as the aqua and pink alternating line. It is aqua when bullish and pink when bearish.
The low price for each candle is then compared to the ALMA. If the low is greater than the ALMA, then there is a bullish trend and the area between the candles and ALMA is filled green. The area between the ALMA and candles is filled red when the low price is less than the ALMA.
The difference between the slow ALMA and candles can reveal a lot about the current market state. If there is a significant green gap between the two, then we know that there is a significant uptrend taking place. On the other hand, a large red gap would indicate a significant downtrend. Similarly, if the gap between the two is narrowing and the ALMA line switches from aqua to pink, then we know that a reversal could be coming shortly.
~Happy Trading~
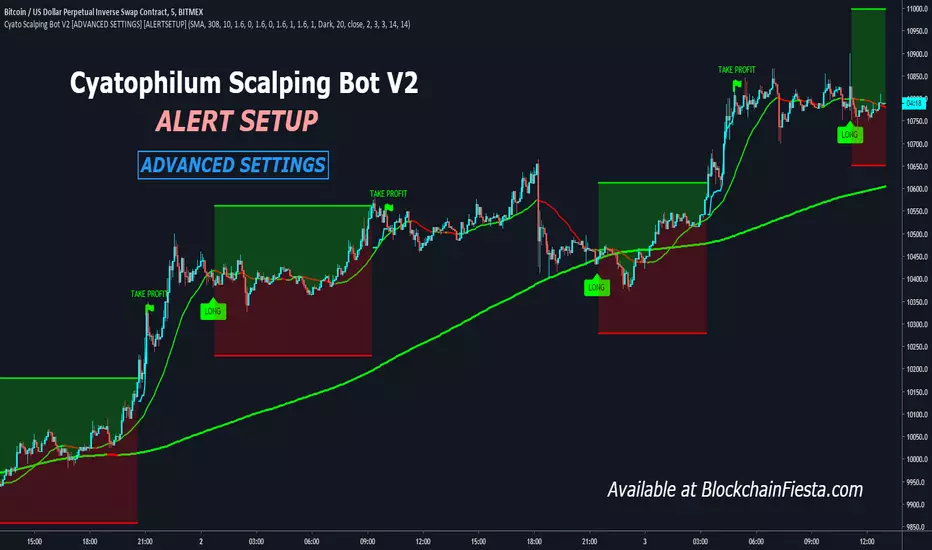
Cyatophilum Scalping Bot V2 [ADVANCED SETTINGS] [ALERTSETUP]Advanced Settings version of Cyatophilum Scalping Bot V2
For people who like tweaking settings =)
Cyatophilum Scalping Bot V2 [ADVANCED SETTINGS] [BACKTEST]Advanced Settings version of Cyatophilum Scalping Bot V2
For people who like tweaking settings =)

Abacus (CMF + Stoch. + Chop.) StrategyThis strategy combines uses Chaikin Money Flow, Stochastic Oscillator, and the Choppiness Index to determine trend strength and direction and generate entry and exit signals. This is a strategy adaptation of our earlier CMF + Stoch + Choppiness Index indicator.

The WaveRunner Multiple Moving AveragesThe WaveRunner consists of a Triple Exponential Moving Average (or TEMA). This study first calculates the exponential moving average(EMA) of the security. It then finds the EMA of that first EMA and then finally calculates a third EMA based on the second EMA. Then, we added in a volume weighted moving average, allowing us to place greater emphasis on periods with higher volume.
Due to its minimal lag, the triple exponential moving average is a good tool for trend identification and volatility measurement. Adding in a VWMA further improves its accuracy as it provides another way to check the strength of a trend.
The first EMA is shown as the green line of circles. The EMA of that line is then plotted as the middle yellow line. Finally, the third EMA is the red line of circles. When the first EMA is greater than the third, it indicates a sustained positive trend and the area between the two lines is filled green. On the other hand, when the third EMA is greater than the first EMA, it indicates a negative trend and the area between the two lines is filled red. Finally, the VWMA is shown as the darker green and red areas both below and above the first EMA.
This indicator is best used for trend identification and confirmation, filtering out volatility. Reduced lag allows traders to interpret sharp price fluctuations.

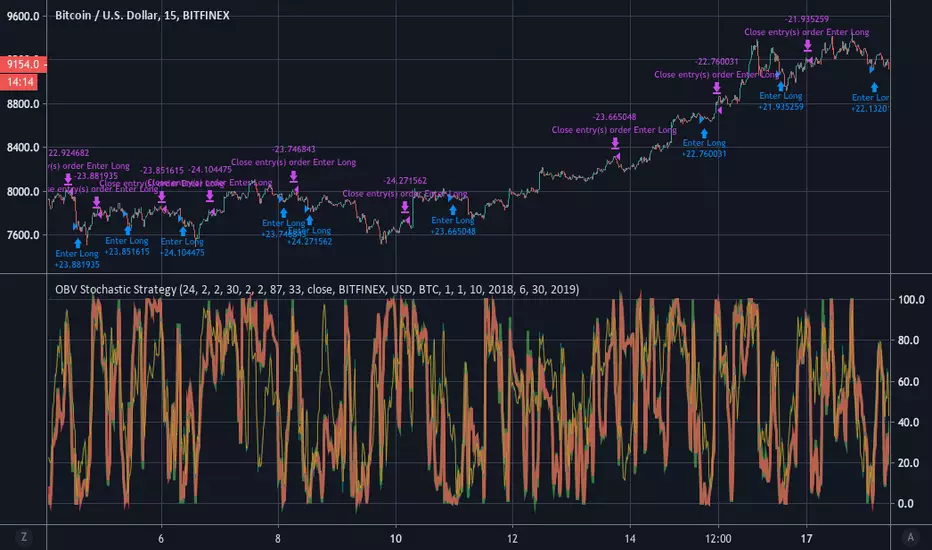
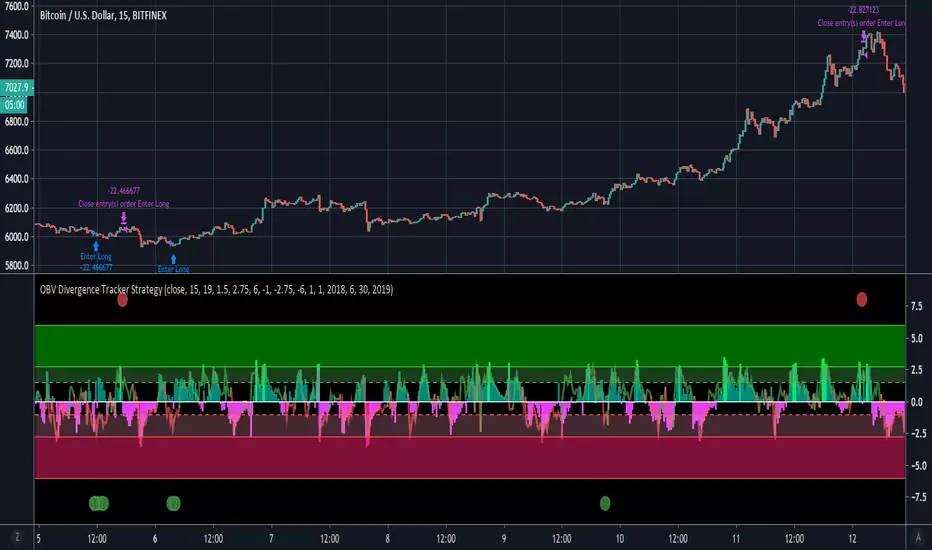
OBV Divergence Tracker StrategyThis strategy combines OBV Z Scores and price Z Scores to identify divergences and generate entry and exit signals.
The K2 StrategyStrategy version of the K2 Indicator. The K2 uses a fast and slow CCI to identify optimal long entry and exit opportunities.

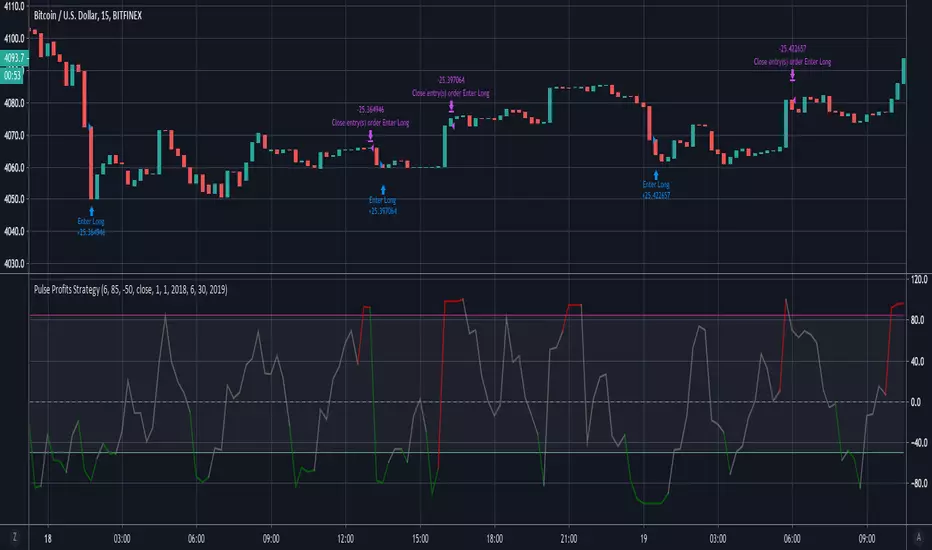
Pulse Profits+ StrategyStrategy Version of the Pulse Profits+ Indicator based on Elder's Force Index and Chande Momentum Oscillator.