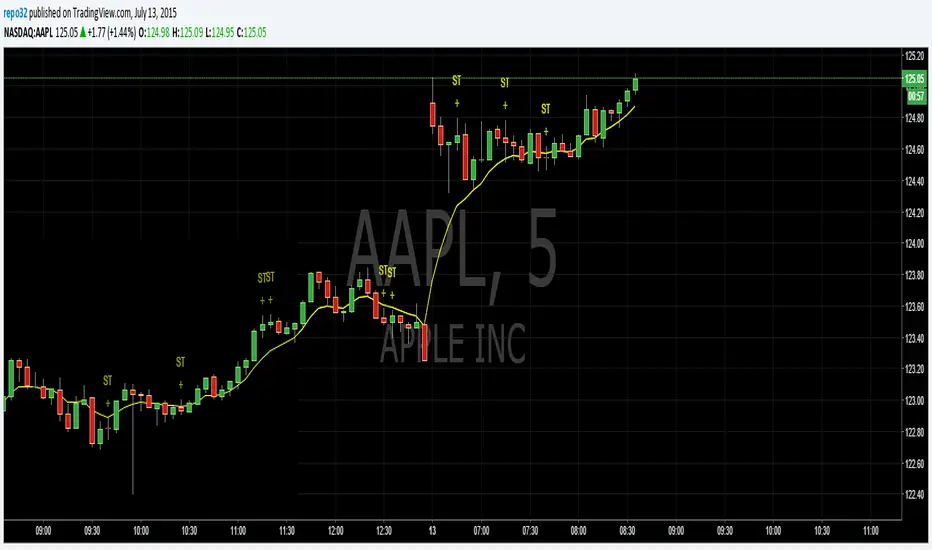
EMA_Cross_Trading_JHVer3.0
- EMA14 and EMA50 Cross detection
- HA 1st profit taking
- Overshoot detection
- Candle shape and Wick analysis
Candle

Not closed yet scriptI made this to serve as a reminder if a candle is not closed yet. This is to avoid entering a trade based on a candle that is not closed because this candle could look alot different by the time it closes. Good luck.

Bearish Engulfing StrictMost of the engulfing indicators i tried seemed to only look at the candle bodies which i didnt like. This one takes into account the highs and lows as well. You get less signals but each one seem to be more reliable.

Closing bars arrowsSimple script which adds arrows above or below bars.
Triangles will appear if close prices is in a above 80% or below 20% of tick price bar.
Default values can be changed from settings.

MTF Previous Open/Close/RangeThis indicator will simply plot on your chart the Daily/Weekly/Monthly previous candle levels.
The "Auto" mode will allow automatic adjustment of timeframe displayed according to your chart.
Otherwise you can select manually.
Indicator plots the open/close and colors the high-low range area in the background.
Hope this simple indicator will help you !
You can check my indicators via my TradingView's Profile : @PRO_Indicators

Percent Change per CandleThis indicator allows you to quickly view the true % change per candlestick (prev close > current close), but it also has 3 other customizable values for you to set your own % change conditions (such as open > high). Feel free to edit the script to suit your own needs as well.
Indecision Candle IdentifierThis script helps identify indecision candles on for better entries into trade reversals. Note that I don't believe this signal/indicator should be used as a sole basis for entering/exiting a trade. This is simply to help you have an edge in terms of your chart/candle analysis when your brain fails to keep up with your trades.

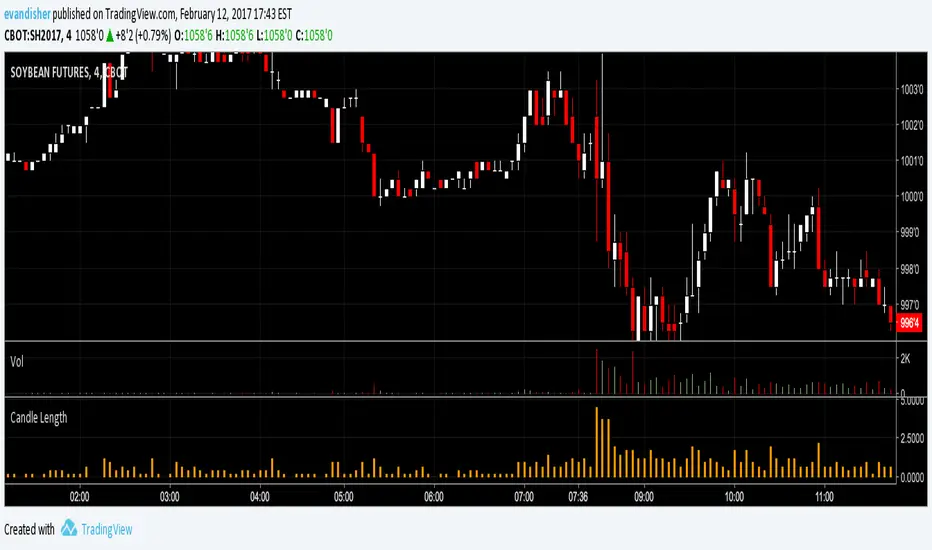
Candle Length by WiscoDishMeasure of the total candle length, including the upper and lower wicks. Works best as a histogram in my opinion. Used as a quick reference for the high minus the low of each candle.
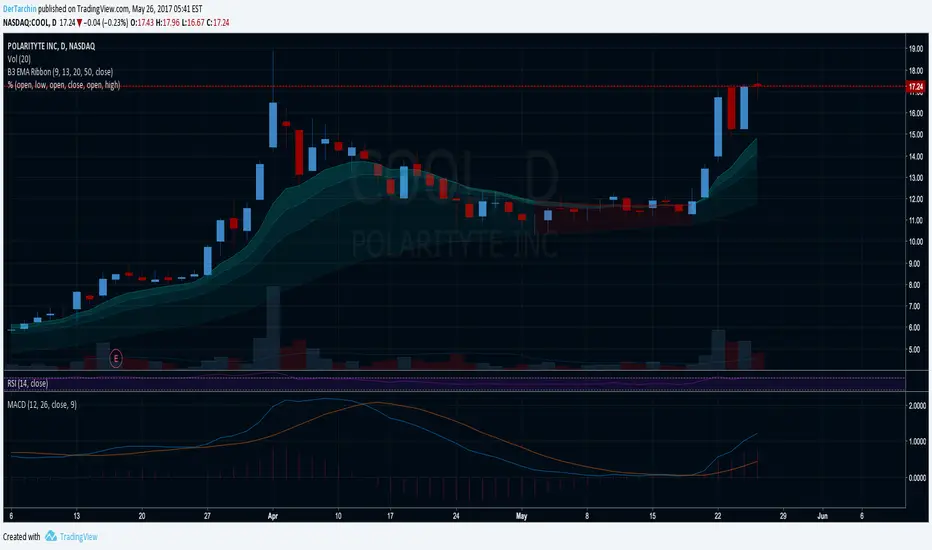
B3 MTF OHLCB3 M ulti T ime F rame - O pen H igh L ow C lose
For showing a 2nd resolution on one chart; Not much more to say about that :)

I_Heikin Ashi CandleWhen apply a strategy to Heikin Ashi Candle chart (HA candle), the strategy will use the open/close/high/low values of the Heikin Ashi candle to calculate the Profit and Loss, hence also affecting the Percent Profitable, Profit Factor, etc., often resulting a unrealistic high Percent Profitable and Profit Factor, which is misleading. But if you want to use the HA candle's values to calculate your indicator / strategy, but pass the normal candle's open/close/high/low values to the strategy to calculate the Profit / Loss, you can do this:
1) set up the main chart to be a normal candle chart
2) use this indicator script to plot a secondary window with indicator looks exactly like a HA-chart
3) to use the HA-candle's open/close/high/low value to calculate whatever indicator you want (you may need to create a separate script if you want to plot this indicator in a separate indicator window)


Should I FOMO??Should I FOMO?? (number of revisited candles in a timeframe)
=============================================================
idea: hecate
I fomo way too much so i have created this little indicator to show me how many times (PERCENT) a candle is revisited in a period P
with the idea that i should not panic and maybe just wait patiently for a better price.
Just set the period P to your desired timeframe, days hours, whatever and WAIT patiently because many times it does come back :D and many times !!


Spinning TopsThis is my script for a spinning top. It is just another form of a doji. It is an indecision bar. Enjoy.
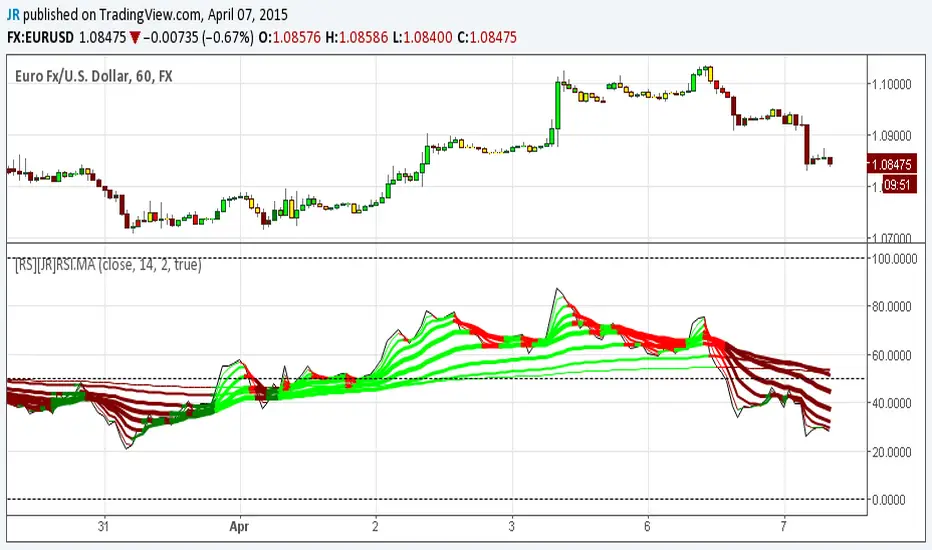
[RS][JR]RSI Ribbon + CandleRSI Ribbon + Candle
By Ricardo Santos and JR
In this chart rendering we are combining RSI and Moving Averages. For an added features we included colors to the candles and ribbons. Lime and green displays a strong bullish trend, yellow is caution or no trade, red and maroon are bearish trends. You can also find divergences using the ribbon.
Divergence