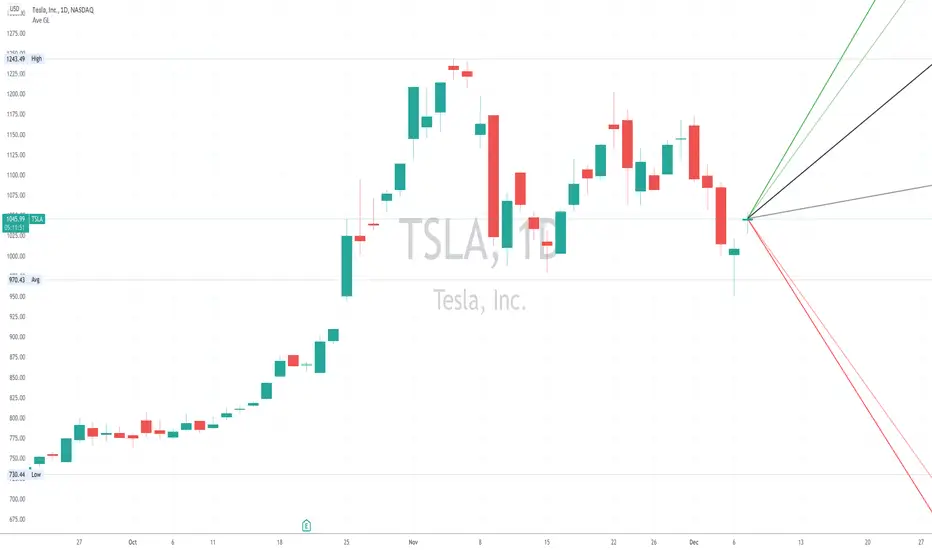
Average Gain/LossThe Average Gain/Loss indicator adds rays to show what the average trade range might be for a given ticker based on historical data.
Green lines are the average gain, red lines are the average loss and black are the overall average.
Darker lines are the average of close to close and lighter lines are the candle averages.
Default average is set to 50 bars but is adjustable in settings.
Have modification ideas for this indicator? Just let me know and I will gladly consider them!
تحليل الشموع اليابانية
Price Action [Morty]This price action indicator uses the higher timeframe SSL channel to identify trends.
The long entry signal is a bullish candlestick pattern when the price retraces to EMA20 in an uptrend.
The short entry signal is a bearish candlestick pattern when the price retraces to the EMA20 in a downrend.
Currently, this indicator shows engulfing patterns, pin bar patterns, 2 bar reversal patterns and harami patterns.
It also shows a volatility squeeze signal when the Bollinger bands is within the Kelter channels.
The buy and sell signal can also be filter by the ADX indicator greater than a threshold.
You can set your stoploss to the previous low/high when you go long/short.
The risk/reward ratio could be 1 to 1.5.
This indicator can be used in any market.

Plot Real Open and Close - SamXI built this indicator as a personal request from a friend. He often trades using Heiken Ashi charts, but wanted a way to easily cross-reference real-price open and close values for the same timeframe on the same chart (as HA candles are by design lagging, they can take a few periods to catch up to a large move). This can also be used to help guide support and resistance zones using real-price data points should you so choose.
There are 2 major ways to configure this indicator to display real-price open and close:
As a Bar or Hollow Candle style chart overlay
As on-chart shapes (allowing individual control over which data to show - open, close, or both)

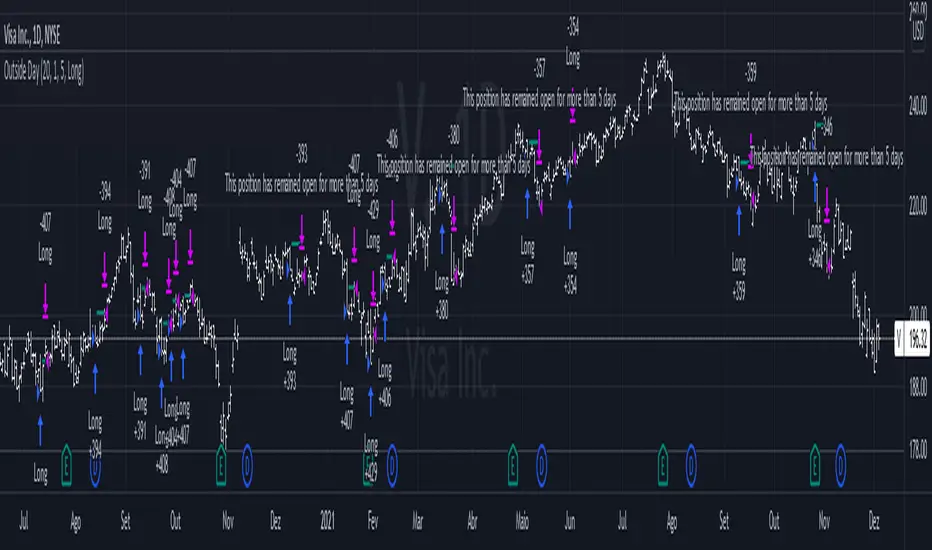
Outside DayThis strategy is taken from Perry Kaufman's book "Trading System and Methods".
You can enter on the direction of the candle, or opposite to it. I find that the opposite tends to yield better results in volatile assets, allowing a better reward to risk ratio. There is no stop loss in this strategy, only a fixed take profit and a time limitation.
*SSS 50% HTF** SSS 50% - HTF (Higher Timeframe) -D/W/M/Q Edition **
This indicator is based on Sara Strat Sniper's - 50% Rule for trading Outside Bars and helps you visual the method quickly.
This indicator allows you to select: Outside: Day/Week/Month/Quarter Warning Levels with Previous High and Low Levels available within the indicators settings.
Please note - Daily warning and high/low levels are set to the indicators default. Feel free to change and save as required. Any issues let me know. See known issues below.
** Indicator Setup Requirements **
For Indicator to correctly display the 50% price level you need to setup your chart correctly. Right-click your chart background, select Settings, select Scales and Tick “Indicator Last Value Label". Now your 50% Price level will be displayed.
Known Issues:
This indicator does not work when you try to view a lower timeframes levels on a higher timeframe chart.
Example 1: Selecting Daily Warning, High and Low Levels will not be displayed correctly on a Weekly timeframe and above etc. The Daily selection however will be displayed correctly on all lower timeframes from the 1 minute chart to the Daily.
Example 2: Selecting Weekly Warning, High and Low Levels will not be displayed correctly on a Monthly timeframe and above etc. The Weekly selection however will be displayed correctly on all lower timeframes from the 1 minute chart to the Weekly. Please apply these same rules for all other timeframe indicator selections.
Monthly Warning, High and Low levels will not work correctly on a Weekly chart when the current Weekly candlestick is forming between the end of a previous Month and start of new Month. Once the first Weekly candle of a new Month closes the Monthly levels will now be displayed correctly. Please note, selecting the Monthly levels when viewing a Monthly chart will work as normal and Monthly levels displayed on a Weekly chart will be corrected once the first Weeks candle has closed. I believe this error is caused by a pine script repainting issue when assessing historical price data which is out of my limited scripting brains control.

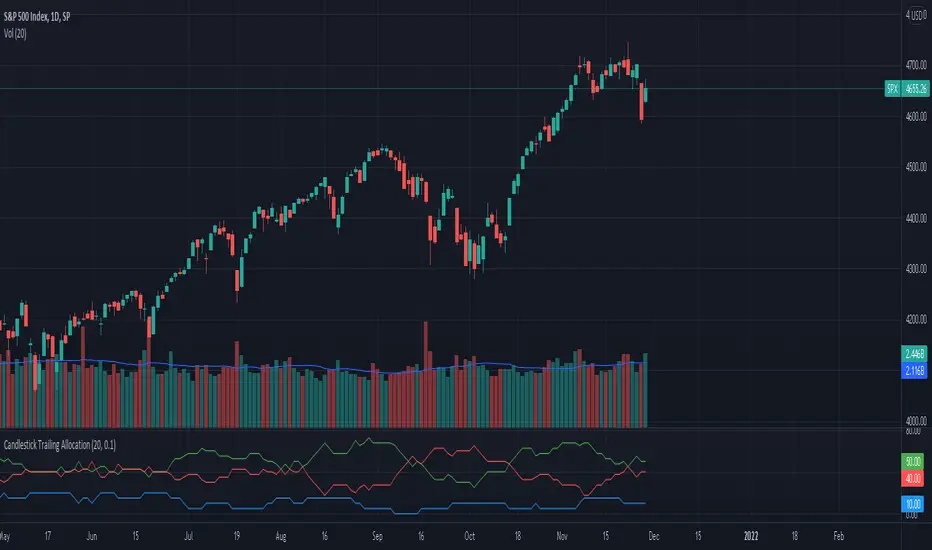
Candlestick Trailing AllocationA simple indicator that calculates the sum of 'Up'(green), 'Down'(red), and 'Doji'(near Doji) candlesticks and portrays the same in an allocation format in percentage. And since it is allocation-based, the total will never exceed 100% of the defined Length period.
The equation is Green + Red + Doji = Total Candles; where total candles = length
When calculating the allocation part, the doji candles are subtracted from the sum of green and red, and the new value is divided by the length period.
For example, the green line = (sum of all green candles - doji / 2) / length; the reason to divide doji by 2 is to eliminate the redundancy it can cause.
When the green line crosses above the red line, the number of green candles is more than red in the defined length period. Similarly, when the red line crossed above the green, there were more red candles than green in that period.
The Doji line shows if any doji or near doji candles have appeared. It acts as a form of resistance against the green and red candles.
There's also the option to change the value of the doji's weight. Default is at 0.1.
The indicator does not show trend nor momentum, even though it may replicate some of its behavior from time to time. It is purely showing the allocation of the number of candles classified as green, red, and doji within the length provided.
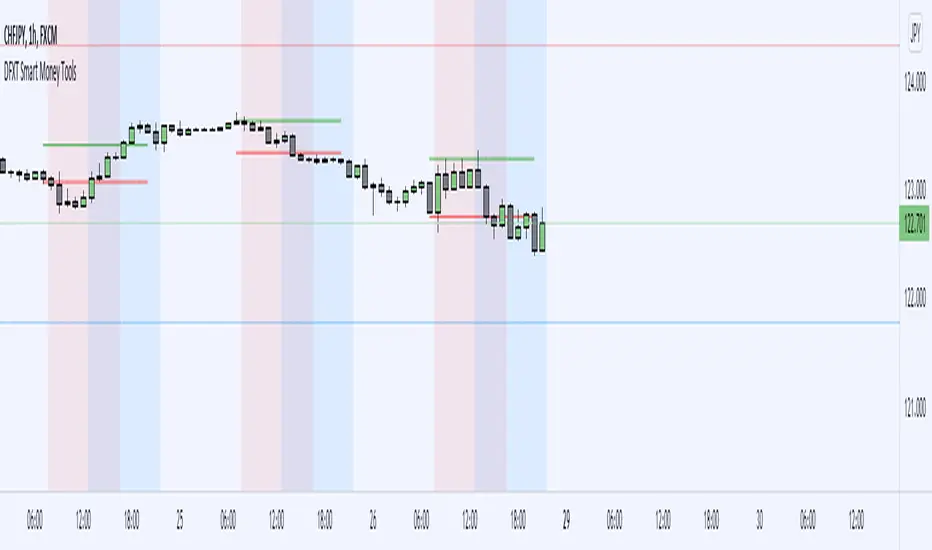
DFXT Smart Money ToolsAdded some additional features that may be useful for those trading smart money concepts.
~ Higher time frame candle Open, High, Low and close marker: for reference of where you are in price.
~ Asian Session High and Low marker: Can be used to clearly see runs on the Asian range.
~ Engulfing Candle detector: Marks engulfing candles in a colour of your choice.
~ Impulsive Candle detector: Marks Impulsive candles in a colour of your choice.
~ Quarter's Theory: Marks Quarter levels on the chart.
~ Doji Candle: Marks Doji candles in a colour of your choice.
~ Inside Bar detector: Marks Inside bars in a colour of your choice.
~ Imbalance detector: Marks Bullish and bearish imbalance in a colour of your choice.
~ Zig-Zag structure: Classic ZZ indicator that can be used to simplify the structure.
~ Liquidity Wicks: Wicks that take Liquidity then close back inside the range.
~ Session Marker: Markers the various trading sessions in a background colour of your choice.
BlockBlock indicator is based on breakdown.
When a candle closes above previous highest high or below previous lowest low a block is made.
When a candle closes below previous highest high or above previous lowest low the block continues and just high and low are updated.
This indicator is very useful for supply and demand strategy.
Have much profit with this indicator.

FX Sessions - All in OneFX Sessions - All In One
This Script offer a wide variety of goodies
SESSION OPEN
it will draw a line for the TOP, MID and LOW of the asian session (you can adjust the hours of the session)
It will draw a line for the TOP and LOW of the London Session (you can adjust the hours of the session)
It will draw a line for the TOP and LOW of the NY Session (you can adjust the hours of the session)
SEPARATORS
while on lower timeframe, you will have a separator for days that occurs at midnight NY time
While on Daily timeframe, you will have a separator that will separate every month, on the 1st trading day of that given month
IMBALANCE
The candle leaving imbalance (a candle where there is a portion that is not matched with a price action left or right)
NY Midnight opening price
a dotted line will be drawn (up to 500 bar limitation) from NY open until it reaches either the 500 bar or the end of the day.
on lower timeframe (below 3 minutes) the bar will not reach the end of the day

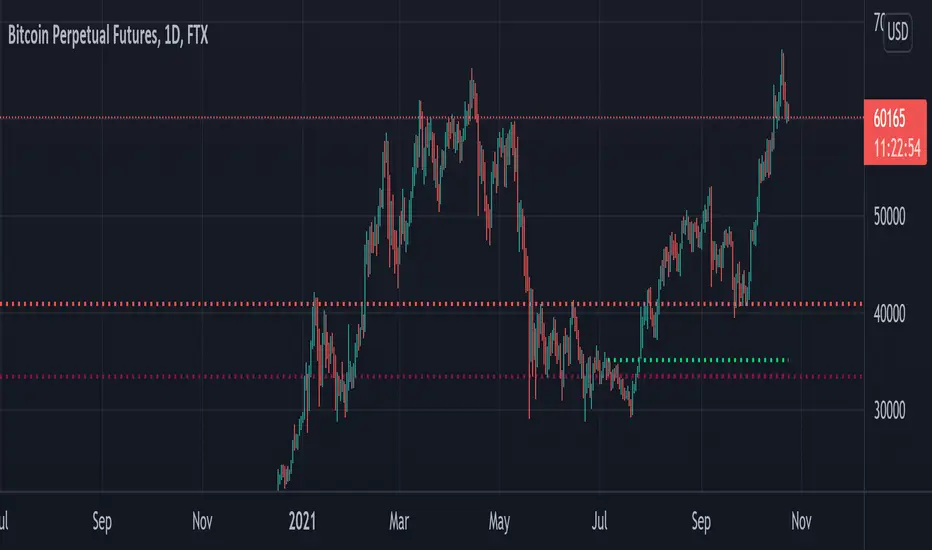
*SSS 50% Rule IndicatorThis indicator is based on Sara Strat Sniper's - 50% Rule for trading Outside Bars and helps you visual the method quickly.
This indicator allows you to select: Outside Day/Week/Month Warning Levels with Previous High and Low Levels all available within the indicators settings.
Please note - Daily warning and high/low levels are set to the indicators default. Feel free to change and save as required. Any issues let me know.
** Indicator Setup Requirements **
For Indicator to correctly display the 50% price level you need to setup your chart correctly. Right-click your chart background, select Settings, select Scales and Tick “Indicator Last Value Label". Now your 50% Price level will be displayed.

Mini Screener (Basic version)By using this script, one can screen four symbols. Therefore, one can select four extra symbols from the setting and follow their last ten candles of them. the color of the labels changes depends of the last candle in each symbol. In other words, if the last candle is green, then label is green.
it is also possible to use it both in light and dark mode by check the "Dark mode" checkbox in setting of the script.
I hope you enjoy it!

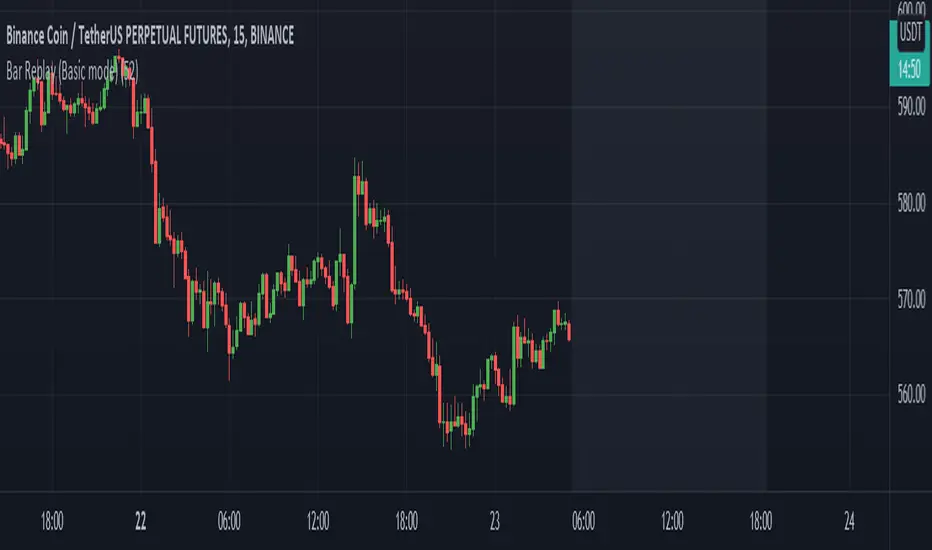
Bar Replay (Basic mode)This script simulates the TradingView's "Bar Replay" mode.
The "Bar Replay" mode works only for time-frames greater than daily in free accounts. By using this script, one can easily apply this mode on an arbitrary time-frame particularly in free accounts.
Note that to use it properly, one should turn off the main candlestick chart from symbol description tool bar. then set the number of bars they like to hide.
I hope you enjoy using this script
NSDT Bearish-Bullish CandlesThis is another interesting take on candlesticks . These Bearish-Bullish Candles do not show the wicks. Instead, the upper wick is made into a Red body and the lower wick is made into a Green body. If you match the candle body color in the chart settings (or turn off the candles completely), you get a unique way of seeing how Bearish or how Bullish a candle is because the wick will now match the body size and color.
This indicator is very similar to our NSDT Special High-Low Candles.

Wick Bodies [vnhilton]I noticed that changing the colour of the wicks through TradingView settings changes the colours of both the top and bottom wicks. I also noticed that the thickness of wicks couldn't be changed either so they remained very hard to see when zoomed out of charts. Wicks have the potential to show zones where price rejects from - this is useful for identifying potential support and resistance zones.
I created an alternative solution to this problem by creating bodies for the wicks. It's recommended that you hide the wicks so it shows candles as bars split into 3 segments (top segment representing top wick; middle segment representing candle; bottom segment representing bottom wick). Colours are customizable. Also includes borders for the wick bodies.

Reversal zone finderThis script would find potential reversal price zones according to RSI over bought or sell condition and big reversal candle.
It works better in range markets and lower time frames like 5M and especially in Support/Resistance zones.
Suit for scalping in forex or crypto markets.
* Use it as a trade assistant not a trade signal!

Alpha Candle Breakout Signal on Momentum from Support Resistance
Hello traders,
Let’s start with a brief description of what this strategy/indicator is and what it does and how we trade based on Alpha Candles.
The definition of an Alpha Candle is that it is mathematically calculated, and significantly bigger than the previous candles. This could be a green candle or a red candle, as long as the body is significantly bigger than the previous candles at the end of the calculation. All calculations are done in real time, we do NOT paint the candle sticks after the close of the candle and do not use offset values. This is extremely important. You will see the candle changing it's color as the body of the candle gets bigger with real time data feed. (Recalculate On Every Tick is ON by default). Now besides the mathematical calculations, an Alpha Candle also represents the emotion in the market for that stock in that moment. We can also say that an Alpha Candle is a change in the momentum.
Now that we’ve identified the Alpha candle, the second step is, to have a look at the chart and identify if the Alpha candle is breaking to a new high / low from a consolidation period, or from a good chart pattern (ascending / descending triangle , pennant , sideways consolidation) or a sudden direction change of the stock (bounce). Remember, the script will paint all Alpha candles regardless.
NVAX day trading example
Forex
Crypto
PLUG (Bounce example)
The script will identify the Alpha candles that are breaking to a new high / low from a user input look back period (default is 20 bars back, but this can be changed by the user input). An Alpha candle that breaks the look back period, will have a stop loss line below for Green Alpha or above for Red Alpha Candle and reward targets, like target1 or target2 (both are user input fields, can be adjusted to personal R values, default values are 2R and 3R)
A 2R means two times the reward (profit) of a 1-unit risk. If you are comfortable of loosing $50 per trade which will be considered 1-unit, then 2R means $100 reward (profit) target and a 3R is $150 reward (profit) target. Those R values will be plotted and/or labelled on the chart with dollar amounts if desired. You can change your R values from the user input area, even with decimal points, like 2.5R or 3.75R. If you shoot for at least 2R, you could be wrong 6 times out of 10, and still make 2R profit, as long as the other 4 trades give you a total of 8R. This is a basic trading concept. It will force the new traders to focus on risk/reward rather then a gambling attitude.
The script is meant to work with candle stick chart patterns only, it is NOT meant to work with ranges, line charts or point and figure charts. It will work with time frames like (seconds,1,2,3,5,10 minute or any minutes, daily, weekly). If you are trading IPOs , there might not be enough data for the script to do the calculation, so just be aware.
The script will identify the candles if they are Green Alpha (going up, bullish ) or Red Alpha (going down, bearish ). In order to see them clearly, we’ve greyed out the rest of the candles, and made Green Alpha candles white, and Red Alphas are left as red. You can change the colors from the user input area.
There is also a look back period, between 1-55 and the initial value is 20 for Green Alpha and 10 for Red Alpha. So, if the Alpha Candle breaks this look back period, it will be considered as an opportunity to take the trade. The code will put the stop loss area, possible target1 and target2 areas with a blue diamond and will draw the resistance/support lines for that Alpha candle. Depending on the individual’s risk tolerance, a label on the right side of the screen will show the risk tolerance (user input value) and the number of shares to be traded based on the risk tolerance (# of shares will be for the last Alpha Candle that is formed, it will constantly update itself with the new Alpha Candle)
For those who might be familiar with the three-bar play, we implemented something similar, so the code will find them in real time. Once an Alpha Candle is formed, if the following candle is a very small candle, also called pin bar , it will be painted to orange, so you can see it clearly. This pin bar is significantly smaller than the previous candles and formed right after an Alpha Candle.
Like anything in life, nothing is free. Meaning you have to work for it. So if you are looking to buy/sell blindly based on some indicators and signals, please do not consider this script. However, once you start using it, you will see how patterns repeat, when they repeat and how they repeat. It will identify the action, but you have to check the validity from the charts, so user discretionary is advised. As an example, if the Alpha candle is breaking from a consolidation period at $10. Let’s assume stop loss is at $9 so the 2R target will be $12, but if there is a possible resistance at $11, then the trader has to decide to take the trade for a possible 1R return, or skip the trade.
We try to approach the trading as a set of rules and processing the trades one by one, with a calculated risk and reward. This script will give you the Candle stick formation that is worth consideration and will draw the Stop Loss area (you can tweak this to your liking), will draw the 2-3R Targets, and will calculate the number of shares to be purchased based on the Risk Tolerance user entered in the user input area. The rest is to let the trade take care of it self.
Charts and patterns work better, when there is enough volume in a particular stock. If the stock is trading very low in volume , things will not work as expected. So, we must focus on the abnormal stocks, like gap gainers, volume gainer stocks, or heavily traded stocks (for intraday trading). For swing or long-term traders, one could look for a Green Alpha candle, assess the risk and possible return and trade the plan on a daily chart pattern (long term), or 15,30,60 min charts for swing trades.
If you are looking to short a stock, look for stocks that are weak (gap downs), so look for Red Alpha formations in that stock.
Once the back testing is turned on, code will generate buy/sell signals, otherwise it will work as an indicator. But please keep in mind….. For day trading, the stock has to be abnormally trading, so the chart patterns and the Alpha Candles work correctly. Volume has to be more than usual. It is the best way to have predictable results for day trading. If the volume of the stock is 2-5 times or more than the average of 20 days period (early in the morning), and even more later in the day, it is a good indication that the stock is trading on an abnormal volume with some news (pre-market abnormality is a good sign for possible abnormality for that stock).
For back testing, user can select from the user input area :
• Long or Short Trades or both or use the script as an indicator
• Close any open position if an Alpha candle forms in the opposite direction
• Pyramid the trades up to 4 levels (allow to buy/sell 4 times in the same direction every time another Alpha Candle forms)
• Breakout/breakdown look back period (every time an Alpha Candle forms and breaks this look back period, it will be a trade opportunity)
• Target Reward areas
• Stop Loss area
• Time frame (change the time frame and observe which time frame made good profit. Test the plan for future trades. Test it in as many abnormal stocks for the day they were behaving abnormal as possible). Time frame is not a user input field, just the time frame of the chart, 2,5,10 min, 1 hour etc.
• Selective date testing (between two dates/times). This is very important as most of the good opportunities comes from abnormal price action with volume . If you back test with the maximum amount of data for that abnormal stock on that day, it will produce unrealistic results, because the stock will have a normal course of trend before the news. Remember, we are looking for stocks that are trading abnormal in both price and volume or stocks like AAPL , TSLA which are trading heavily on each day. It is also a good way to learn, how and when to buy/sell, where to put stop losses by observing the chart with the Alpha Candles showing the results.
• All the above values will have an impact on the total profit / loss.
F (Ford Motors)
Now that we’ve covered what the script does, let’s plan the trade and trade the plan.
Side Note:
-------------
We started coding this as an indicator to show the Alpha Candles to find opportunities in the market. Later in the development, we implemented it as a Strategy, to be able to back test the ideas, to tweak some rules for entry/exit and see the effects on our profit/loss percentages in general. We kept the original idea being an Indicator, to show us the Alpha Candles in real time. This requires the option “Indicator Mode” is to be selected from the User Input area, and leaving the “Recalculate On Every Tick” is selected from the Properties tab of the strategy (as of Pine Script v5). Strategy is turning this “On” by default.
Disclaimer: This script is an educational and personal use only tool and should be used accordingly. User can not publish any images created with this code. Do your own due diligence, do not buy / sell stocks based on any indicator, always use stop losses. We do not make any promises as this indicator or any indicator will make you a profitable trader. Trading and technical analysis is difficult, it takes time to build confidence and experience. Study the charts and candlestick formations. Study support/resistance areas and how to identify them. This will help you to tweak the script’s stop loss areas and 2R-3R targets. Do not invest any money you are not comfortable loosing.
This is an invite only strategy. We will give ample time to test it out. After that you will need to subscribe. To get access to this strategy trader can send me an email from the links below.
All the Best
Happy Trading

Higher Time Frame Chart OverlayHello All,
This script gets OHLC values from any security and Higher/Same time frame you set, then creates the chart including last 10 candles. it shows Symbol name, Time Frame, Highest/Lowest level of last 10 candles and Close Price at the right side of the chart as well. Closing price text color changes by the real-time candle of the related symbol and time frame. The all this was made using the Tables in Pine and the chart location doesn't change even if you change the size of main chart window.
Almost everything can be change as you want. You can change/set:
- Colors of Body and Top/Bottom Wicks separately
- The Height of each Cell
- The Width of Body and Wicks
- The Background and Frame color
- Enable/disable Status Panel (if you disable Status Panel then only candle chart is shown)
- Location of Status Panel
- Text color and Text size
- The Background color of Status Panel
Some examples:
The info shown in Status Panel:
You can change The Height of each Cell and The Width of Body and Wicks
You can change colors:
You can change location of the chart:
If you add the script more than once then you can see the charts for different symbols and time frames: (This may slow down your chart)
If you right-click on the script and choose "Visual Order" => "Bring to front" then it will be better visually:
P.S. Using this script may slow down your chart, especially if you add it more than once
Enjoy!

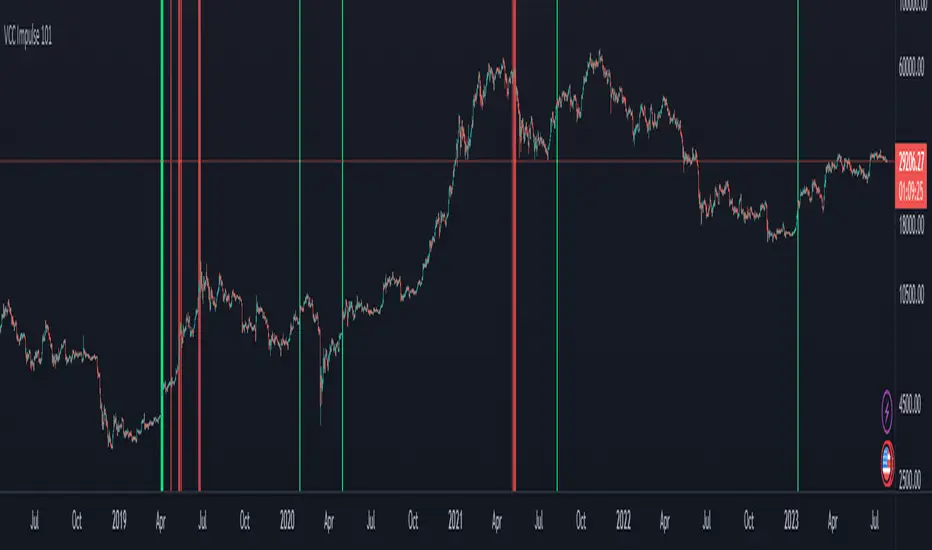
VCC Impulse 101Title = VCC Impulse 101
Version = v1.2.0
Author = Vic Cebedo
A cryptocurrency Buy and Sell signal indicator.
BUY SIGNAL (green background) is triggered if Buy Score (black line) reaches (4) Points.
1 Point is added to Buy Score if:
- The Closing Price is above all Moving Averages (7, 21, 50, 100, and 200), and
- If the 200MA is above the other Moving Averages (7, 21, 50, 100).
1 Point is added to Buy Score if:
- MACD is greater than MACD Signal, and
- MACD is greater than zero, and
- MACD Signal is greater than zero, and
- MACD is greater than previous value.
1 Point is added to Buy Score if:
- SMI is greater than zero, and
- SMI is greater than previous value.
1 Point is added to Buy Score if:
- RSI is greater than 50.
The SELL SIGNAL (red background) is triggered if EITHER Ethereum Sell Score (purple line) OR Bitcoin Sell Score (red line), reaches (-3) Points.
2 Points is deducted from the Ethereum Sell Score if:
- The number of Ethereum Short positions is greater than the Longs.
1 Point is deducted from the Ethereum Sell Score if:
- The Ethereum RSI is greater than 75.
2 Points is deducted from the Bitcoin Sell Score if:
- The number of Bitcoin Short positions is greater than the Longs.
1 Point is deducted from the Bitcoin Sell Score if:
- The Bitcoin RSI is greater than 75.
CandleEvaluationLibrary "CandleEvaluation"
Contains functions to evaluate bullish and bearish, engulfing, and outsized candles. They are different from the built-in indicators from TradingView in that these functions don't evaluate classical patterns composed of multiple candles, and they reflect my own understanding of what is "bullish" and bearish", "engulfing", and "outsized".
isBullishBearishCandle()
Determines if the current candle is bullish or bearish according to the length of the wicks and the open and close.
int _barsBack How many bars back is the candle you want to evaluate. By default this is 0, i.e., the current bar.
returns Two values, true or false, for whether it's a bullish or bearish candle respectively.
isTripleBull()
Tells you whether a candle is a "Triple Bull" - that is, one which is bullish in three ways:
It closes higher than it opens
It closes higher than the body of the previous candle
The High is above the High of the previous candle.
int _barsBack How many bars back is the candle you want to evaluate. By default this is 0, i.e., the current bar.
returns True or false.
isTripleBear()
Tells you whether a candle is a "Triple Bear" - that is, one which is bearish in three ways:
It closes lower than it opens
It closes lower than the body of the previous candle
The Low is below the Low of the previous candle.
int _barsBack How many bars back is the candle you want to evaluate. By default this is 0, i.e., the current bar.
returns True or false.
isBigBody()
Tells you if the current candle has a larger than average body size.
int _length - The length of the sma to calculate the average
float _percent - The percentage of the average that the candle body has to be to count as "big". E.g. 100 means it has to be just larger than the average, 200 means it has to be twice as large.
returns True or false
isBullishEngulfing()
Tells you if the current candle is a bullish engulfing candle.
int _barsBack How many bars back is the candle you want to evaluate. By default this is 0, i.e., the current bar.
int _atrFraction The denominator for the ATR fraction, which is the small amount by which the open can be different from the previous close.
returns True or false
isBearishEngulfing()
Tells you if the current candle is a bearish engulfing candle.
int _barsBack How many bars back is the candle you want to evaluate. By default this is 0, i.e., the current bar.
int _atrFraction The denominator for the ATR fraction, which is the small amount by which the open can be different from the previous close.
returns True or false

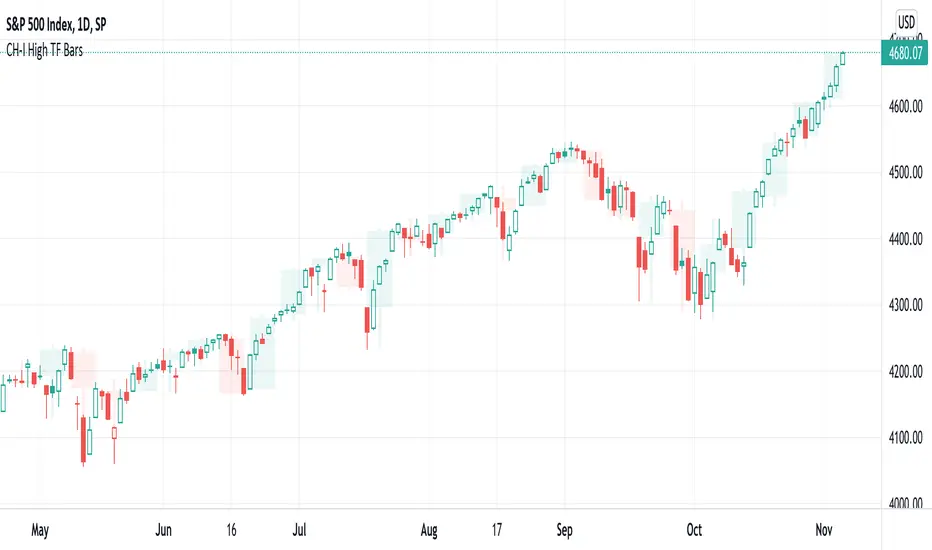
CH-I: Trend - Higher Timeframe BodyI took the script for the built-in indicator for candle bodies of a higher timeframe (www.tradingview.com) which has a fixed border width and style and added the possibility to customize both the border width and the border style or to even disable the display of any border at all, which makes the presentation of those boxes more flexible.
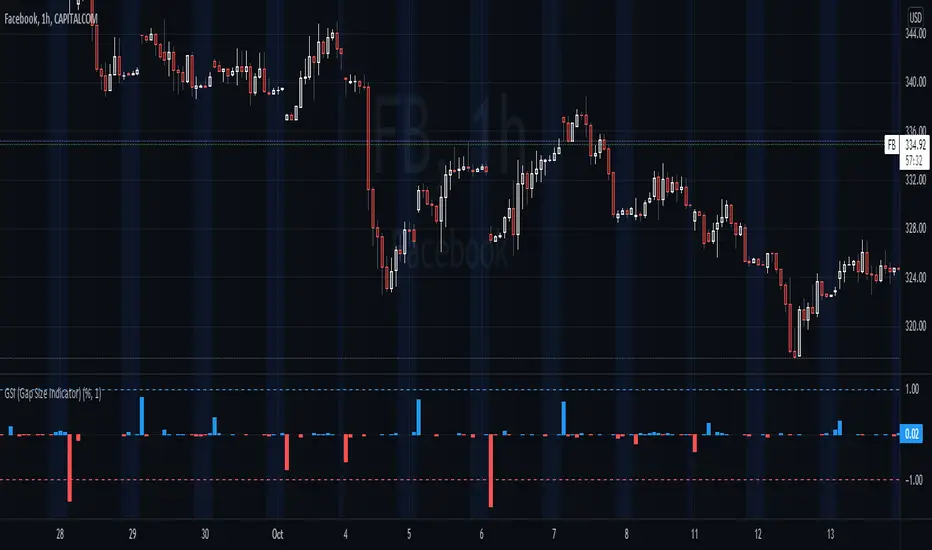
GSI (Gap Size Indicator)The purpose of this indicator is to give a quick view of a gap size between two candles, and to detect any gap bigger than the trigger setting.
Options
Mode: Select the display mode (% or Value)
Variation Trigger: Defines the minimum gap size to give a signal, for both positive and negative sides. This option depends on the Mode setting
Show trigger lines: Enable/Disable the display of the Variation Trigger setting lines
Color signals only: When enabled, bars crossing the trigger value are still colored, but other are gray
Show signals only: When enabled, will only show bars corresponding to gaps crossing the trigger value
Notes
Basic alerts on Bullish , Bearish and All gaps are available.
Feel free to suggest any improvement.
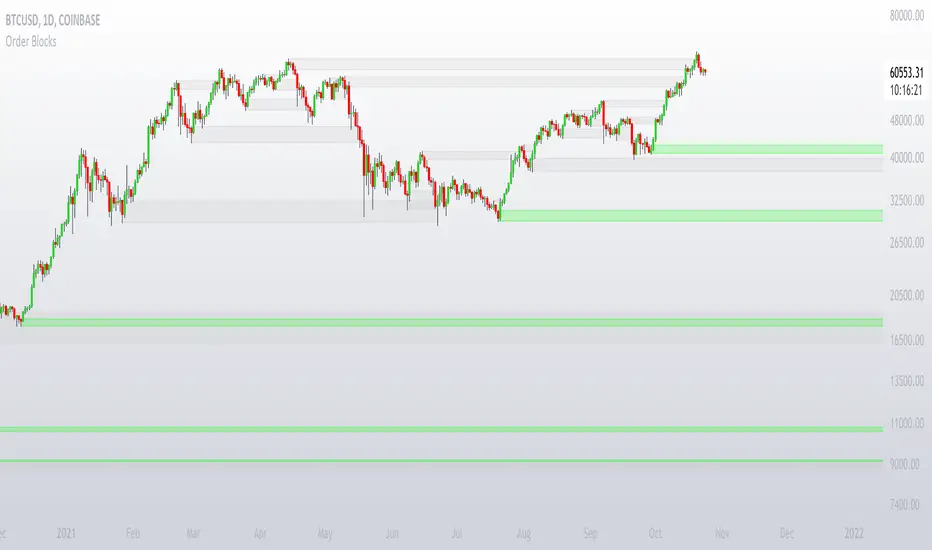
Order BlocksThis is experimental Indicator is to help identifying Order Blocks.
It uses not confirmed higher order pivots as Higher Highs (HH) and Lower Lows (LL), finds high/lows that created most recent LL/HH and in case if this high/low are broken it notes candle that broke structure, market structure broke line (MSB) and demand box (candle that created liquidity for the move that broke structure).
Concepts and parts of code used in this study:
1) @rumpypumpydumpy - Higher Order Pivots
2) @MarkMiddleton2020 - Order Blocks
Compression support&resistance [LM]Hello traders,
I would like to present you Compression support&resistance script. The idea behind is to look for areas of price compression(inside bar candles). Basically the S/R lines are created after three candles that are formed in certain pattern and volume conditions. First candle of pattern is usually the most volatile and fist inside bar after volatile candle high and low creates S/R lines in order to look for breakouts or for future bounces of the S/R line. Also by default volume has to be decreasing from candle to candle, although this condition can be controlled by setting.
It has various settings as my other S/R scripts for multi timeframe analysis. The current timeframe uses line API but for multi timeframe I use plot lines. There are two filters. Volume filter for declining volume of the pattern candles and volatility filter which renders line only in case that pattern occurs after some % change has happened within some lookback period.
Credit also for this indicator goes to @berkek as he took time to explain it to me.
Hope you will enjoy it,
Lukas