MTM - Momentum IndicatorMTM - Momentum
Description
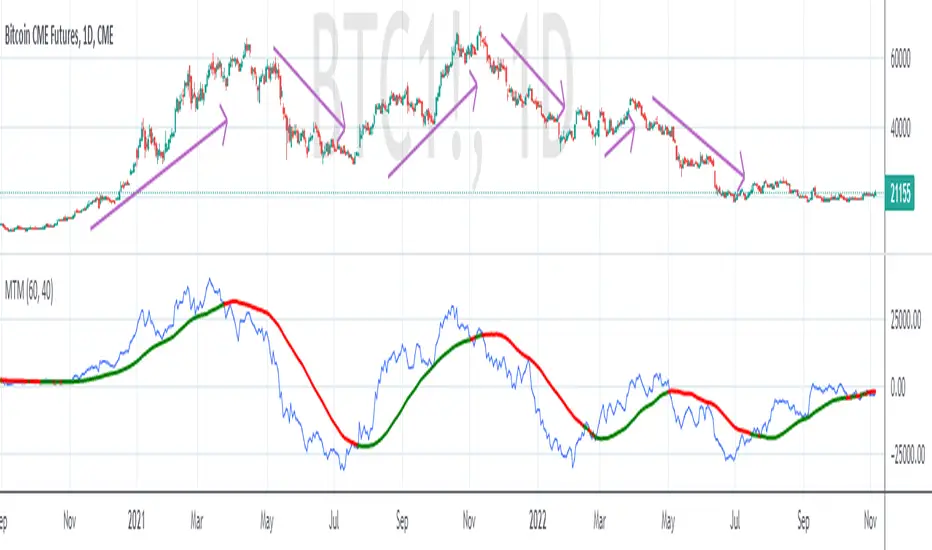
The Momentum indicator is a speed of movement indicator that is designed to identify the speed (or strength) of price movement. This indicator compares the current close price to the close price N bars ago and also displays a moving average of this difference.
Category
Momentum Indicators
Parameters
N ( Default: 6 Min: 1 Max: 100 )
N1 ( Default: 6 Min: 1 Max: 100 )
Chart Script
MTM : CLOSE-REF(CLOSE,N);
MTMMA : MA(MTM,N1)
www.edgerater.com
متذبذبات التمركز
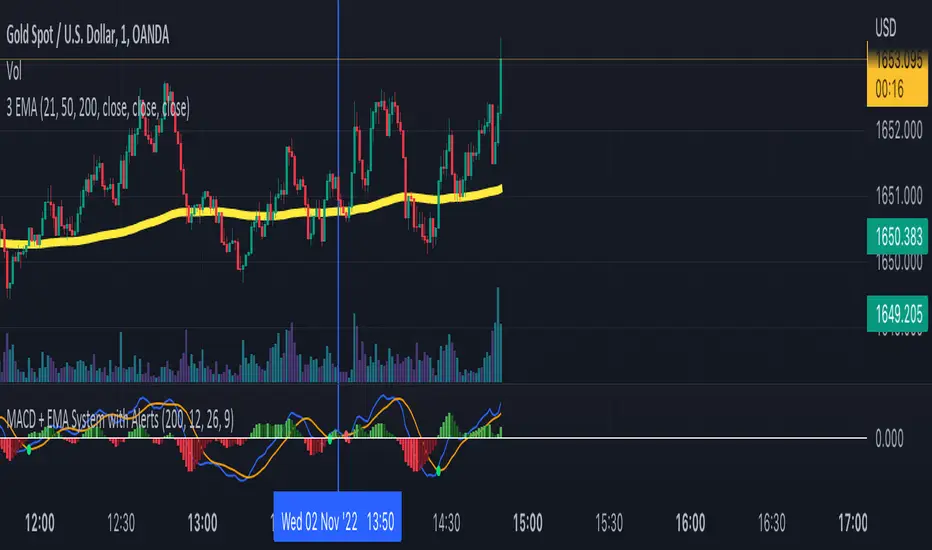
MACD + EMA System with AlertsSo I created the MACD Cross Strategy but not working alone by itself. I added EMA (Exponential Moving Average) filter to improve its winning rate so the MACD Signal only appears when in the same trend direction as Moving Average.
The Main Rules for Long Signal are:
- MACD Main Line Crossover the MACD Signal Line.
- The crossover happens below the MACD center line (0) so the momentum is strong.
- Price above the EMA 200 so it means the market is in a strong uptrend.
The Main Rules for Short Signal are :
- MACD Main Line Crossunder the MACD Signal Line.
- The crossover happens above the MACD center line (0) so the momentum is strong.
- Price below the EMA 200 so it means the market is in a strong downtrend.
The signal crossover & signal alert only generate as per the following rules above.
TMO ScalperTMO - (T)rue (M)omentum (O)scillator) MTF Scalper Version
TMO Scalper is a special custom version of the popular TMO Oscillator. Scalper version was designed specifically for the lower time frames (1-5min intraday scalps). This version prints in the signals directly on top of the oscillator only when the higher aggregations are aligned with the current aggregation (the big wheels must be spinning in order for a small wheel to spin). The scalper consist of three MTF TMO oscillators. First one is the one that plot signals (should be the fastest aggregation), second serves as a short term trend gauge (good rule of thumb is to us 2-5x of the chart time frame or the first aggregation). The third one (optional) is shaded in the background & should only serve as a trend gauge for the day (usually higher time frames 30min+).
Time Frames Preffered by Traders:
1. 1m / 5m / 30m - This one is perfect for catching the fastest moves. However, during choppy days the 1min can produce more false signals..
2. 2m / 10m / 30m - Healthy middle, the 2min aggregation nicely smooths out the 1min mess. Short term gauge is turning slowly (10min for a signal to confirm).
3. 3m / 30m / 60m - This TF is awesome for day traders that prefer to take it slow. Obviously, this combination will produce far less signals during the day.
Hope it helps.

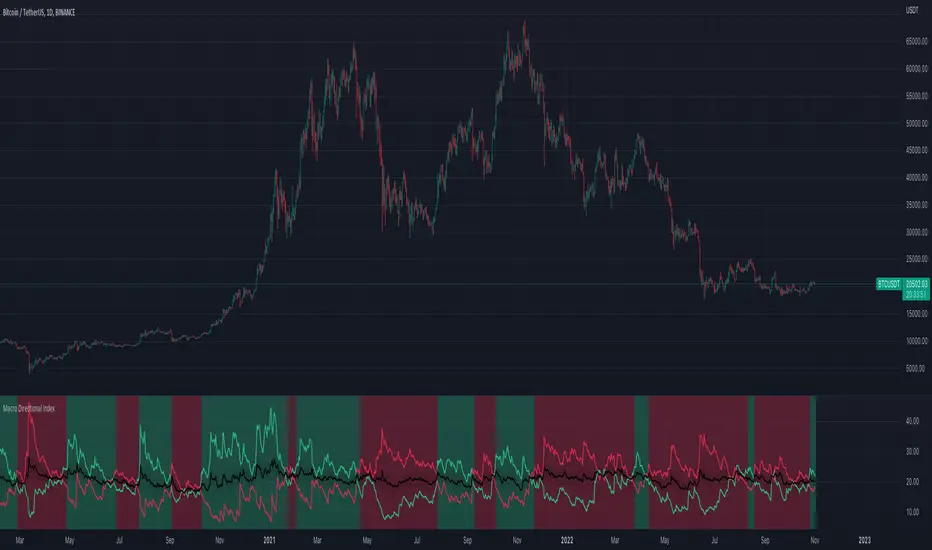
Macro Directional IndexCore to this indicator is the rate at which DI+ and DI- are moving away or towards each other. This is called The Rate of Change (ROC). The ROC length dictates how many bars back you want to compare to the current bar to see how much it has changed. It is calculated like this:
(source - source /source ) * 100
This indicator has 4 values in the status line:
DI+
DI-
Distance between DI+ and DI-
DI Rate of Change
DI Rate of Change
The rate of change is smoothed using an EMA. A shorter EMA length will cause the ROC to flip back and forth between positive and negative while a larger EMA length will cause the ROC to change less often. "Since the rate of change is used to indicate periods of 'consolidation', you want to find a setting that doesn't flip back and forth too often.
Directional Index Middle Channel
Between the DI+ and DI- is a black centerline. Offset from this centerline is a channel that is used to filter out false crosses of the DI+ and DI-. Sometimes, the DI+ and DI- lines will come together in this channel and cross momentarily before resuming the direction prior to the cross. When this happens, you don't want to flip your bias too soon. The wider the channel, the later the indicator will signal a DI reversal. A narrower channel will call it sooner but risks being more choppy and indicating a false cross."
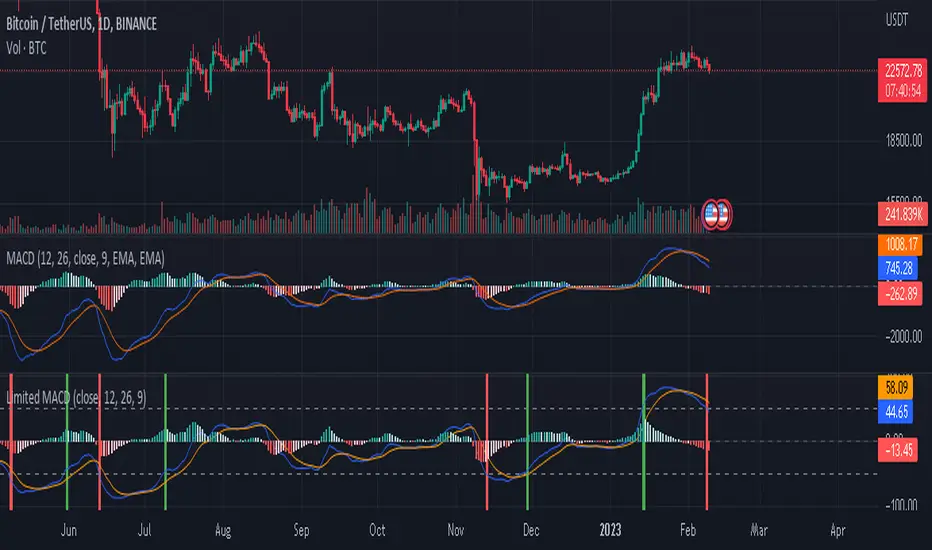
Limited MACDwhat is "Limited MACD"?
it is macd but it has some useful additional features.
what it does?
it takes limited values ??just like rsi. The highest value it can take is 100 and the lowest value is -100. this way it gets the same highs and lows for different symbols and time slots. which means we can set overbought and oversold values ??with it. he also paints candles according to their values. The closer the price is to the oversold values, the more red, and the closer to the overbought values, the greener.
how it does it?
macd values ??are limited by dividing by extreme values. The macd value is used as the variable for the color.rgb function, this is used to get a different color for each macd value.
how to use it?
The variables in the settings section are the same as standard macd.
Use the colors to identify overbought and oversold zones and to predict possible price reversal points. also the indicator will mark possible turning points. other than that, its use is similar to standard macd and its limits are up to your imagination.
four hour:
one hour:
five minute:
Rolling MACDThis indicator displays a Rolling Moving Average Convergence Divergence . Contrary to MACD indicators which use a fix time segment, RMACD calculates using a moving window defined by a time period (not a simple number of bars), so it shows better results.
This indicator is inspired by and use the Close & Inventory Bar Retracement Price Line to create an MACD in different timeframes.
█ CONCEPTS
If you are not already familiar with MACD, so look at Help Center will get you started www.tradingview.com
The typical MACD, short for moving average convergence/divergence, is a trading indicator used in technical analysis of stock prices, created by Gerald Appel in the late 1970s. It is designed to reveal changes in the strength, direction, momentum, and duration of a trend in a stock's price.
The MACD indicator(or "oscillator") is a collection of three time series calculated from historical price data, most often the closing price. These three series are: the MACD series proper, the "signal" or "average" series, and the "divergence" series which is the difference between the two. The MACD series is the difference between a "fast" (short period) exponential moving average (EMA), and a "slow" (longer period) EMA of the price series. The average series is an EMA of the MACD series itself.
Because RMACD uses a moving window, it does not exhibit the jumpiness of MACD plots. You can see the more jagged MACD on the chart above. I think both can be useful to traders; up to you to decide which flavor works for you.
█ HOW TO USE IT
Load the indicator on an active chart (see the Help Center if you don't know how).
Time period
By default, the script uses an auto-stepping mechanism to adjust the time period of its moving window to the chart's timeframe. The following table shows chart timeframes and the corresponding time period used by the script. When the chart's timeframe is less than or equal to the timeframe in the first column, the second column's time period is used to calculate RMACD:
Chart Time
timeframe period
1min 🠆 1H
5min 🠆 4H
1H 🠆 1D
4H 🠆 3D
12H 🠆 1W
1D 🠆 1M
1W 🠆 3M
You can use the script's inputs to specify a fixed time period, which you can express in any combination of days, hours and minutes.
By default, the time period currently used is displayed in the lower-right corner of the chart. The script's inputs allow you to hide the display or change its size and location.
Minimum Window Size
This input field determines the minimum number of values to keep in the moving window, even if these values are outside the prescribed time period. This mitigates situations where a large time gap between two bars would cause the time window to be empty, which can occur in non-24x7 markets where large time gaps may separate contiguous chart bars, namely across holidays or trading sessions. For example, if you were using a 1D time period and there is a two-day gap between two bars, then no chart bars would fit in the moving window after the gap. The default value is 10 bars.
//
This indicator should make trading easier and improve analysis. Nothing is worse than indicators that give confusingly different signals.
I hope you enjoy my new ideas
best regards
Chervolino

Multi-Indicator Divergence ScreenerHere is a new screener for everyone.
I have applied my Better Divergence On Any Indicator logic to scan 3 different indicators and up to 6 different assets at one time. Shoutout to LonesomeTheBlue and QuantNomad for their respective work on divergence and scanner scripts. I've implemented similar logic to put together this scanner.
So far, I have added support for RSI, OBV, MACD, MFI, Stochastic, and FSR, though I'm happy to add more by request. Please note, for simplicity, I have removed the logic to filter for only overbought/oversold divergences. Because this can scan both centered oscillators and non-centered indicators, overbought/oversold does not apply to all of them. I may try to find a way to work in back in later, as time allows.
Personally, I like to find confluences different types of indicators. For instance, agreeable divergence with a centered strength oscillator like RSI and a volume based indicator like OBV gives me more confidence that there will be follow-through.
Like in the Better Divergence script, you can opt to scan for confirmed divergences, potential divergences, or both.
You have the option to show or hide a table that will tell you exactly which assets have divergence, on which indicator they were found, and how many points of divergence were identified. By default, bull divergences will be green, bear will be red, but you can change these base colors to your liking. Confirmed divergences are shown with a solid background, while potentials (if selected) are shown with transparent background. If all 3 of your chosen indicators have divergence in the same direction, the asset name will show in the bull or bear color to highlight the confluence.
Alerts have also been set up to fire on bar close. The message will essentially tell you the same thing the table does, but in condensed format.
You can choose to have alerts fire any time there is any divergence detected across all assets, only when there are divergences on at least 2 of the chosen indicators for a given asset, or limit them to only when all 3 indicators show divergence in agreement.

Know Sure Thing - Weekly Candle VersionKnow Sure Thing - Plotted on weekly candles (source from Martin Pring)
Developed by Martin Pring, Know Sure Thing (KST) is a momentum oscillator based on the smoothed rate-of-change for four different timeframes.
Modifications:
Arrows representing long/short signals based on the timeframe (S for short term, M for mid term, L for long term)

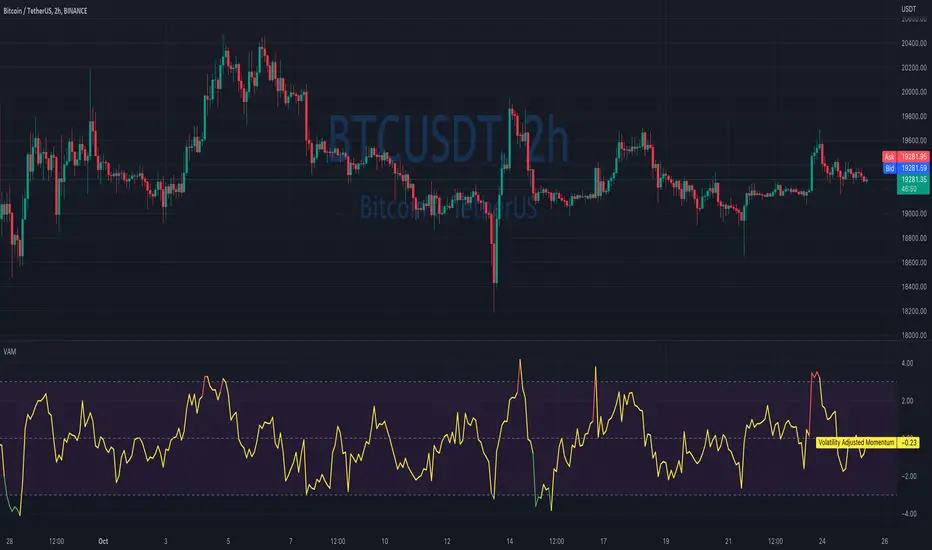
Volatility Adjusted MomentumIt's a script that computes volatility-adjusted momentum indicators.
The problem with the momentum indicator is that it's absolute and it's hard to interpret its value. For example, if you'll change the timeframe or instrument value of Momentum will be very different.
We tried to solve that by expressing momentum in volatility. This way you can easier spot overbought/oversold values.
You can choose to use Standard Deviation or ATR for adjustments.
Thanks to @MUQWISHI for helping me code it.
Disclaimer
Please remember that past performance may not be indicative of future results.
Due to various factors, including changing market conditions, the strategy may no longer perform as well as in historical backtesting.
This post and the script don’t provide any financial advice.
Ichimoku MA Up & DownIchimoku and MA use the default.
It is repainted because it uses a moving average line.
A marker is only true if it was created after the candle closed.
The principle is too simple.
Please enjoy using it.
- Up : Conversion Line > MA #1 and Base Line > MA #2
It is an uptrend. The short-term moving average should be above the conversion line. And the long-term should be above the Base Line.
- Down : Conversion Line < MA #1 and Base Line < MA #2
It's a downtrend. The short-term moving average should be below the conversion line. And the long-term should be below the Base Line.
You can get better results if you use a momentum indicator like RSI.
Thank you.

Fisherized CCIIntroduction
This here is a non-repainting indicator where I use inverse Fisher transformation and smoothing on the well-known CCI (Commdity Channel Index) momentum indicator.
"The Inverse Fisher Transform" describes the calculation and use of the inverse Fisher transform by Dr . Ehlers in 2004. The transform is applied to any indicator with a known probability distribution function. It enables to transform an indicator signal into the range between +1 and -1. This can help to eliminate the noise of an indicator.
The CCI is an momentum indicator which describes the distance of the price to the average price.
For smoothing I used the Hann Window and NET (Noise Elimination Technique) methods.
Additional Features
Divergence Analysis
Trend-adaptive Histogram
Timeframe selection
Usage
It is usually used to spot potential trend reverals or mean-reversion (against the trend) trades on lower timeframes. IMO it can be even used to spot trend-following trades. It always depends on which settings you have, which timeframe do you use and which indicators you combine with it.
The suggested timeframe for this indicator is 15 min (with the length setting on 50).
The histogram with adaptive mode enabled could be used as filter applied on the buy and sell signals.
The divergence analysis can help to spot additional entries/exits or confirm the buy and sell signals.
Always try to find the best settings! This indicators has a lot of customization options you should take advantage of.
Signals
The indicator uses the following logic to generate the buy and sell signals:
Normal
Buy -> When CCI and MA go above the top band (usually +100) and cross
Sell -> When CCI and MA go below the the bottom band (usually -100) and cross
Fisherized
Buy -> When CCI and MA go above the the zero line and cross
Sell -> When CCI and MA go below the the zero line and cross
Have fun with the indicator! I am open for feedback and questions. :)

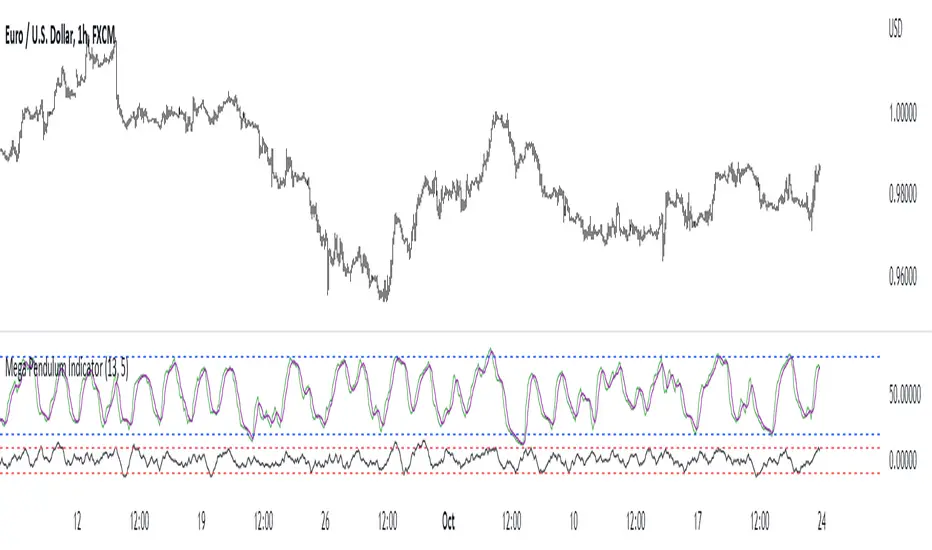
Mega Pendulum IndicatorThe MPI (Mega Pendulum Indicator) is a fusion between the Pendulum Indicator and the Swing Indicator and is used with specific trading rules.
The MPI is a semi-bounded oscillator comprised of two lines. The first bounded line is the Pendulum Indicator which oscillates between 0 and 100 but generally oscillates between 20 and 80. The second semi-bounded line is the Swing Indicator which generally oscillates between -10 and 10.
The conditions for trading the Mega Pendulum Indicator are as follows:
* Buy: Whenever the Pendulum indicator crosses over its signal line (a 5-period moving average) and at the same time, the Swing Indicator must cross over -10 after having been below it.
* Sell: Whenever the Pendulum indicator crosses below its signal line (a 5-period moving average) and at the same time, the Swing Indicator must cross under -10 after having been above it.
Qube [AstrideUnicorn]Qube is an indicator that shows market regimes. It is able to detect medium and long term trends and ranging markets. If the indicator bars are colored blue and are between the two blue lines, it means that the market is in sideways movement or consolidation. If indicator bars cross the upper boundary and are colored green, it means that the market is in an uptrend. Red bars crossing the lower blue line indicate a downward trend. The red or green columns are further referred as signal bars.
The indicator is based on the normalized momentum oscillator raised to the third power. This is done to increase the sensitivity of the indicator and to emphasize the difference between the market modes.
The indicator can be used in different ways. One of them is determining the trend direction based on the last signal bar. Even if the current indicator bar is blue (showing range or consolidation), the user should consider the longer-term market mode as upward if the last signal bar is green. And vice versa, if the last signal bar is red, the current market bias is downward. One other way to use the indicator is to catch active price impulses, when columns of the same color (red or green) appear consecutively.

Directional Slope Strength IndexThe most basic of trend indicators is the price change over some period of time. Rate of change is the most common indicator to use which calculates the current price minus the price n bars back. I've written this indicator to solve several problems the default value of ROC.
1. We're interested in the magnitude or strength of the slope of change.
2. We need a number that we can make decisions from between 0 and something close to a peak of 10.
3. We need the ability to define a threshold where a directional change might be taking place.
The Directional Slope Strength Index solves these problems by taking 1000 samples of your given Rate of Change input and calculating a standard score (or z-score) which represents the number of standard deviations by which the current rate of change is above or below the historical average. A higher number represents a stronger move up and a lower (negative) number represents a stronger move down. A value closer to 0 would represent a sideways trend or the slowing of a current trend.
A potential threshold could be 2 or -2 which is two standard deviations from the mean ROC.
The inputs can be modified to control the sensitivity.
1. A lower ROC length would provide a more sensitive measure, but still measure how that sensitive input changes over 1000 samples.
2. I recommend keeping the sample rate at 1000 as that provides enough historical data to give a more accurate distribution and therefore a more accurate DSSI (z-score).
A number of decisions can be made from the indicator:
1. When the DSSI crosses above 2, it could be a sign of a strong move upward. When below -2 it could be a sign of a strong downward move.
2. When the DSSI persists in a positive or negative channel between 0 and 2 or 0 and -2 this could indicate the formation of the next trend.
3. Values outside 2 and -2 standard deviations should be interpreted as high volatility environments.
4. For convenience, a highest and lowest DSSI have been plotted to provide references to the historical extremes.
I'm open to any questions and feedback as this is a first, original indicator for me.

[blackcat] L3 Gann B-XtrenderLevel 3
Background
The Gann Slope indicator has been welcomed by the community since its release, and many people are trying to integrate it into their trading systems. One of these is the need to integrate Gann Slope into QuantTherapy's B-Xtrender @Puppytherapy.
Function
You can find QuantTherapy's script above , he recreated a trend following indicator published in IFTA Journal by Bharat Jhunjhunwala. It is mainly to be traded on big timeframes.
As requested, i replaced the oscillator part with my Gann slope oscillator. However, I found the setting for input parameters for B-Xtrender is rather complex, you need to take great care to tuning them for specific time frame and trading pairs. Pls don't be lazy to apply this indicator to your chart and expect good results. You have to try and find proper values of them to obtain acceptable results.
Remarks
Feedbacks are appreciated.
stochastic + tsvStochastic, Stochastic RSI with TSV band indicator
This indicator uses 4 indicators to produce long/short entry signal. Buy/Sell signals are trigged only when every indicator points same direction.
Indicators and long/short condition for each indicator included in this script are as follows.
- EMA: long condition when close > ema 200, short for close < ema 200. Optional
- Stochastic: if stoch K touched oversold line, long condition would be activated until K crosses 50 line. From overbought to 50 for short condition.
- Stochastic RSI: Same with Stochastic
- TSV band: tsv > 0 for long, tsv < 0 for short.
