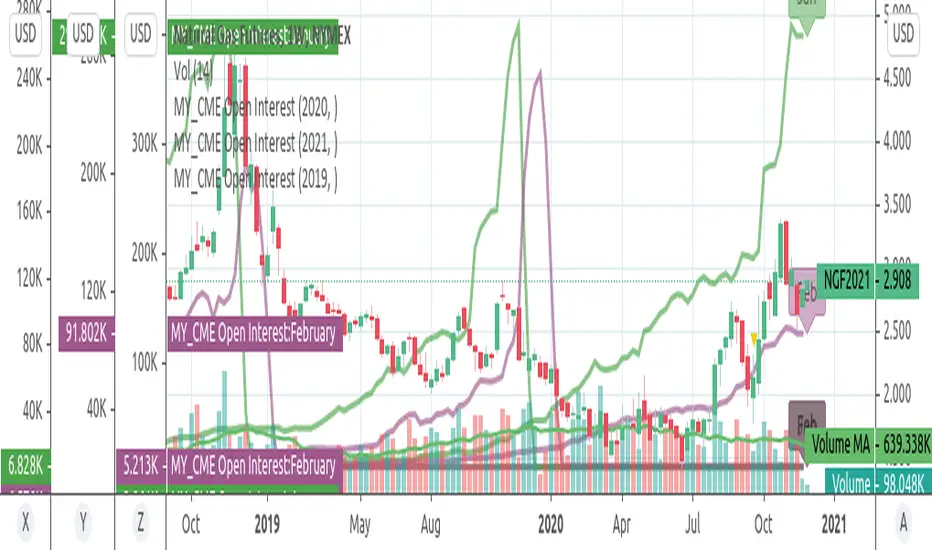
MY_CME eod OI vs CFTC eow OIDaily e-o-d Open Interest as published by CME.
As CFTC COT Open Interest relates to last Tuesday, here you can have an idea how things evolved day-by-day since then.
As CME total OI is not accessibl as data, here I sum OI of the next 9 outstanding contracts, which gives a fair idea of the trend in OI
بورصة شيكاغو التجارية

Neo BitMEX Futures Hedge Grid Alerts Premium v1.0This indicator was made to streamline finding the optimal entry to cash and carry/hedge on a futures contract when margin trading.
Explanation of the indicator:
This indicator has built-in alert conditions that you can use to give you email alerts, in-browser sound alerts, or SMS alerts. These alerts are based upon futures prices being in contango or backwardation.
From top to bottom, the grid shows XBTU18, XBTZ18, OkEx's Quarterlies (OKCOIN:BTCUSD3M), and CME's futures.
Red: Futures are trading above your defined range (default 1%) of spot
Maroon: Futures are trading above twice your defined range of spot
Lime: Futures are trading below your defined range (default 1%) of spot
Green: Futures are trading below twice your defined range of spot
What's configurable:
% to trigger
Grid size
Bar color toggle
Label toggle
Spot/index source (Bitfinex's BTCUSD, BitMEX's XBTUSD, and BitMEX's XBT Index are available)
Pricing:
Currently this standalone indicator is 0.007 BTC for lifetime use.
Example of use:
On 4 May 2018, BitMEX's XBTU18 was trading >2% above perpetual swap. The grid alerts signaled that and if one were long on bitcoin spot on any exchange, then it would have been a good idea to hedge a short on XBTU18. Eventually from there the premium gap was closed while bitcoin fell.
Here is the indicator shown with bar coloring and labels.

MY_CME Open Interestend-of-day Open Interest as provided by CME for D interval.
Can select Commodity (Gold.Silver,Crude), year, contract (Feb,April,June,AugOct,Dec)

Bitcoin Futures Expiry/Settlement DatesVersion 0.9 beta:
- Takes heavy performance showing history expiry dates

BTC: CME Futures vs. Exchange SpreadsAs you can see, this script plots the current (10-min. delayed) CME Futures price versus Bitfinex, Bitstamp, and Coinbase prices.
It's displayed here on a 30 minute view because at the time of writing the futures have been alive for approximately one day. The script will likely be more useful on longer time frames as a macro-level indicator.
It's pretty simple to adapt this to additional exchanges

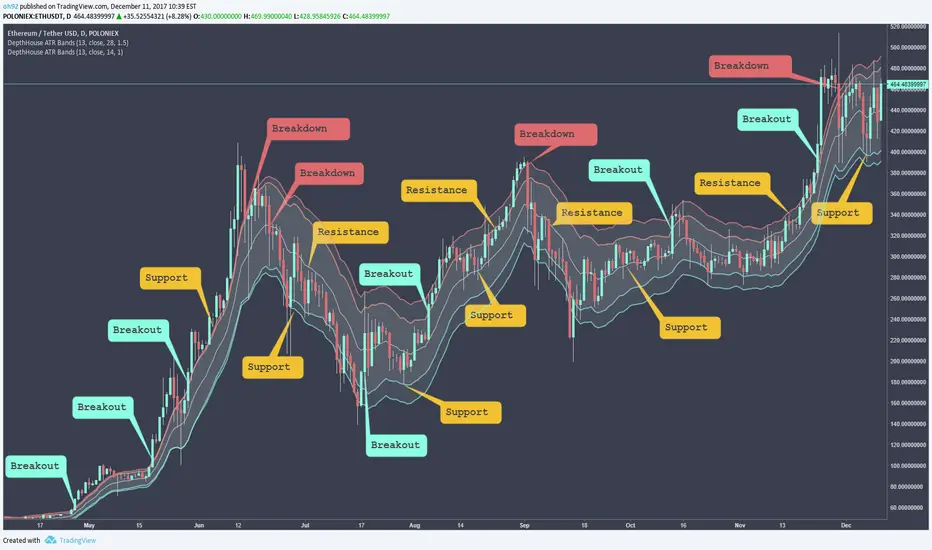
DepthHouse - ATR BandsDepthHouse ATR Bands is a FREE INDICATOR
Similar to the well-known Bollinger Bands.
Instead of using the standard deviation formula, ATR Bands determines the size of the bands based on the adjustable average range.
IF you use this FREE Indicator:
Please like and comment!
Check out my channel on YouTube! youtu.be
Bitcoin and Ethereum Donations are always appreciated :)
BTC : 1MLnVPqebcFTqYEVAKm9dSCRWhyNDmAb5W
ETH : 0xEEcD7Ce6E22AfA6083074c4CCd326Be0b1C932d9
How to use:
The bands tighten while the markets’ range becomes lower, and widens as its' range becomes broader. Giving the indicator a loaded spring effect.
A break outside of the bands in either direction indicates a possible breakout.
All 3 bands serve as possible support and/or resistance. Meaning breaks back into the bands could indicate a reversal, or end of the breakout.
This indicator is completely customizable, so compiling multiple sized bands on top of each other may create a strong competitive edge.
--
IF YOU SUBSCRIBED
This indicator was intended to be available for purchase Jan 2018.
However, with recent change of mind I have decided to make it free to use.
IF you previously subscribed. I greatly appreciate your interest and I hope you enjoy this now FREE indicator!
Once again, thank you!