MarketVision Screener█ OVERVIEW
• Screens 36 Assets at Once
• This Screener is Unique in that it turns my MarketVision series of Indicators Into a Complete Trading System
• To help you Automatically find Possible Turning Points in the Market the Following MarketVision Parameters are Displayed
o Linear Regression Direction and whether Price can be considered Over Bought / Sold according to the Linear Regression Channel (This works exceptionally well if used in confluence with manually drawn Fibonacci retracements)
o RSI value and Over / Very Over Bought / Sold condition
o Trend Meter – Shows Condition of the Trend Meter and its associated Trend / Money Flow Bar
o Wave Trend Crossing Condition taken from MarketVision B or Cipher B
o Wave Trend Divergences
o Super Trend Direction – Not a usual MarketVision parameter but it helps
• Furthermore you can choose where abouts on your chart you want the Screener displayed – this allows for multiple Screeners on one chart
█ HOW TO USE IT
• Look for Confluence between different parameters,
• For example Linear Regression Pointing Down and Price Over Bought according to both RSI and Linear Regression Channel, this is where you can look for maybe a Wave Trend cross down or a specific Candle Stick Pattern on you Chart with a Divergence
• Other confluences that work well are Trend Meter cross at the same time as a Wave Trend cross – Look for This Symbol "⯅ ⬱🡅⇶" or "⬱🡇⇶ ⯆"
• There are many possibilities the rest is up to you and your Trading Style / System
• Feel the Power
█ LIMITATIONS
• Can Not Set Alerts at This Stage – This is for a future Update or Script
• Slow Loading Time – As this is a rather long script Loading time is dependent on Internet Speed and your Computer Hardware
█ CREDITS
• Tradingview for the Pine Script Engine found under the hood of these amazing scripts
• QuantNomad and Others for their pioneering work making it possible to bring these sorts of advanced scripts to life
█ DISCLAIMER
• Not Financial Advice BUT
• Always use Proper Risk / Money Management – Never Risk more than you can Afford to Lose, Preferably not more than 1% - 2% of your Account
• Do Not FOMO or Revenge Trade
• Please remember that Past Performance may not be indicative of future results
Due to various factors, including changing market conditions, the strategy may no longer perform as well as in historical Back Testing
CPR

CPR by Hindustani Sandeep MalikThis script is based on the Secret of Pivot Boss book by Frank Ochoa.
You can view the Daily timeframe CPR/s1-s5 support/r1-r5 resistance.
You can view the Weekly timeframe CPR/s1 support/r1 resistance.
You can view the Monthly timeframe CPR/s1 support/r1 resistance.

CPR with Developing Pivot RangeThis Developing Pivot Range(DPR) made by Saravanan_Ragavan based on Pivot Boss Developing Pivot Range Concept. This indicator will show how the CPR is developing during the day. Also it shows how trend developing. range fills with green and widening in up trend, wise versa range fills with red and widening in down trend.
Pivot Boss described as following about this indicator:
The Developing Pivot Range (DPR) indicator dynamically calculates the central pivot range in real time as new data enters the market bar by bar. Essentially, this indicator allows you to see the “meat of the market” as the day’s trading activity is taking place. More importantly, however, the closing values for the indicator tell you where the central pivot range will be located for the following session, which paves the way for analyzing extremely important two-day pivot range relationships and key width characteristics. Having this information in advance allows us to prepare properly for the
upcoming session.
Note: Today Session end DPR become Tomorrow's CPR.
Hope this Helps you!

CPR BY DTTThe Central Pivot Range Indicator was created by Mark Fisher in his The Logical Trader book with some improvements made by Frank Ochoa. This indicator can seem very simple at first since it is a variation of the typical pivot points you see but this indicator aims to capture much data for the market sentiment for each stock that I will go over in detail. This indicator is known as the swiss army knife of pivots for a good reason.
First, this indicator will let you know one method of finding the current trend of the stock by determining where the price lies in comparison with the Central Pivot Range. If the price isn't touching and is above the Central Pivot Range then this stock is in a big uptrend that has a high chance of it continuing. Same for the reverse if the price isn't touching and is below the Central Pivot Range. Another method is when the current Central Pivot Range for the current period is higher than the previous Central Pivot Range and this means that the stock is in an uptrend and vice versa.
Second, you can tell much about if this stock is currently in a trending or sideways market by looking at the spacing between the 3 lines. If there is a bunch of space between each line then the stock is currently in a sideways market or in other words not much volatility. If there is very little space between each line then the stock is currently in a trending market and this means much volatility and so you need to trade in the direction of the current trend.
Finally, this indicator works as a general support and resistance system like a typical pivot point indicator and so you would go long if the price breaks through the resistance level which would be the top line or go short if the price breaks below the support level which would be the bottom line.
I have included many options in my script to allow you to see other support and resistance levels like extended pivot points, high and low points, and pivot points using data that will project what tomorrow's pivot points will look like. Let me know if you find any other uses for this indicator and of course if you have any questions for me!

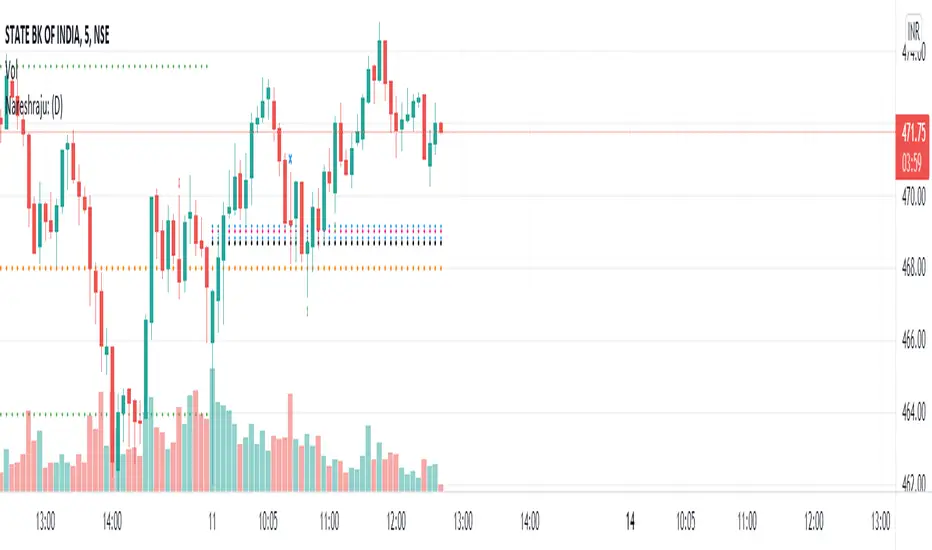
Nareshraju CPRHi friends this is Cpr indicator which means central pivot range. it contains supports and resistances to take perfect entry.
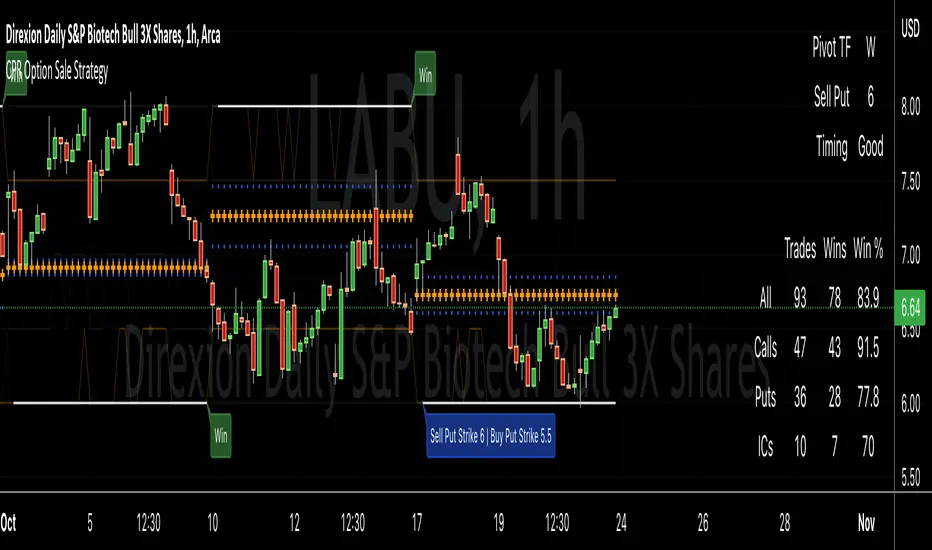
CPR Option Selling StrategyGood afternoon traders,
This is a script I built for option selling, in attempt to have a high success rate.
The gist of how it works:
It uses the opening or close of the current chart's timeframe opening bar when referenced against a designated (higher) timeframe's central pivot range (CPR).
Using that comparison, this script calculates an option to sell: put, call, or iron condor. It will calculate a call value using an average of the CPR central pivot and the max value of the prior higher timeframe's high or R1 (whichever is higher.)
It does the same for the put side, but uses the higher timeframe's low or S1 (whichever is lower.)
It will use the option on the other side of the source (open or close) of the CPR as the "option in play."
Settings:
There are many settings, most are simply "viewable" settings, and probably self explanatory, others, not so much:
"Source for Trigger" - this is the value used on the "opening bar," such as the close. This value is the one compared to the Central Pivot Range in determining whether to sell a call (if the source is lower,) sell a put (if the source is higher,) or an iron condor if it's in the CPR.
"Show Historical Win/Loss Percentages" - this shows a table in the bottom right of the W/L percentages for the current ticker and settings. Used for a quick glance at historical success rates.
"Extend Developing Levels Into the Future" - This will extend the developing values for CPR values, call and put values into the future (good for trying to trade early or setting up pre-market trades, assuming there will not be huge gap in one direction or another.)
"Select Higher Timeframe" - "Auto" will choose the higher timeframe for you. "Manual" will use the next field...
"If Manual, Timeframe for Pivots" - allows you to choose a different higher timeframe.
The next two sections are simply whether to show the plots for different levels of traditional and/or camarilla pivot points.
The last section will allow you to just filter on certain days. Really only useful for "backtesting" certain 0DTE trades on some daily options during the hourly chart.
Example use:
An example use (which I completed last week) on the chart referenced in this share: I sold a put-spread for $0.90, selling a 590 and buying a 570 strike in the middle of the week. I was looking at an hourly timeframe chart with a weekly pivot timeframe for the strategy.
Obviously, making only $0.90 on a $20 spread, there is a lot more to lose than to make, but I did some other analysis to go with it, so I felt safe, and I had a stop set for $1.50. So it worked, along with 3 other plays I did, very similar, and if that "Historical Win/Loss Percentage" is accurate, which I am fairly certain it is, I felt good about it.
The key all comes down to what you sell it for, right? That piece only you can determine. :)
Happy trading and enjoy,
Deuce
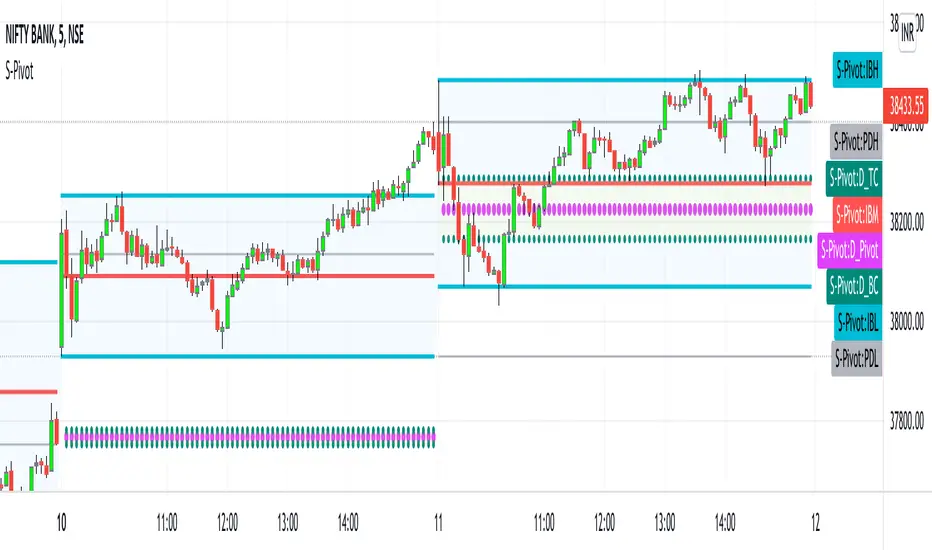
CPR_Previous Day Ranges_Initial BalanceHello Traders,
This script best works on Indian Index (Tested on BANKNIFTY & NIFTY)
This indicator can be used only for day trading (intraday: ex: 5min, 15min Timeframes) on indices.
This script helps to plot
1. Central Pivot Range(CPR)
2. Previous Day Ranges (PDH & PDL)
3. Initial Balance(IB)
brief description of indicators:
1. CPR: Central Pivot Range --> This indicator helps to identify key price points to set up trades. CPR is beneficial for intraday trading.
2.Previous Day Ranges: These ranges will help to understand the current day market.
PDH: Previous Day High value on current day
PDL: Previous Day Low value on current day
3.Initial Balance(IB):This indicator will help in day trading. IB will plot current day first 1hr high, low & mid values.
Disclaimer: This indicator can be used as refrence only. This has been tested on Banknifty and Nifty indices on day trading 5 minutes and 15 minutes timeframe. Understand yourself to knowledge of different trading methods.
Day ClueDay Clue Indicator
live Market Information
Day Clue Indicator plots days information like " Initial Balance and Range ", " Day Range ", " Current Day Volume (for NIFTY and BANKNIFTY it takes the future volume) ", " ATR ", if the scrip is NIFTY or BANKNIFTY then it shows the difference between SPOT and Future price so that trader will come to know future is trading at premium or discount,it shows current day name at bottom right corner, and it plots the Ema-20 and Ema-200. These information will update during live market.
Information for Next Trading Session
Day Clue Indicator plots " Previous Day High" , " Previous Day Low ", " Central Pivot Range-CPR with S1 and R1 ","It indicate tomorrow is Trading Day or Trading Holiday(other than Weekend Holidays)" these are information used for next day that will be plot today itself once market closed
Limitations of Day Clue Indicator
Day Clue Indicator only work in Indian Market(NSE and BSE)
Day Clue Indicator only work in " 1-mins, 5-mins, 15-mins " Timeframes, if you switch to other timeframe like 30-mins,1-Hour, Daily then information will hide
Thank You

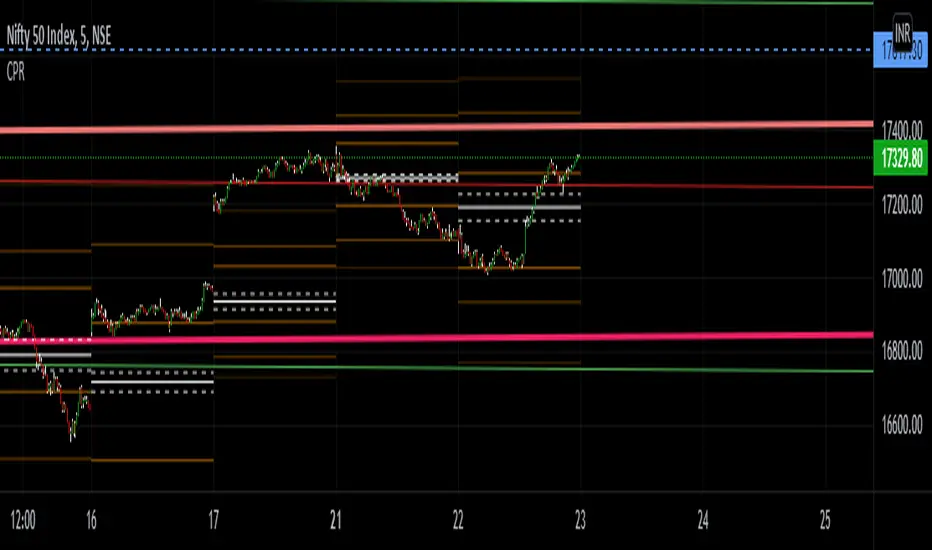
Central Pivot Ranges (CPR) & 3 x VWAP & BarcolorsThis Script Combines daily, weekly and monthly VWAP (Volume Weighted Average Price) with a intraday, daily, weekly and monthly CPR (Central Pivot Range) - which is considered by some traders as the bread and butter of the market for a reason. A combination of Multiple CPRs and VWAPs from different timeframes can provide you with interesting confluences that can give you more confidence in performing your trades.
CPR Features:
- The option to look at current or developing CPRs.
- A resolution selector for all 4 CPRs
- Options to hide and show Tops, Bottoms and Pivots separately
- Various Styling options
- Alerts
VWAP Features:
- 3 x preset VWAPs set to daily, weekly and monthly
- VWAP Lines from the daily O&C or H&L
- Previous VWAP for S/R
- Line Styling options
General Features:
- Barcolors by pivots crossed or daily, weekly and monthly VWAP.
- Barcolors by daily VWAP additionally contain an O and C check instead of just taking the price above or below the VWAP into consideration.

Central Pivot Range 2xBased on a modified Hancock Pivot Range.
Displays the Central Pivot Range for 2 customisable Timeframes Along with Targets which are based on Classic Pivot Point Extensions.
The Pivot Point Extensions are Extended to the right of the price chart which helps eliminate unnecessary clutter
TF1 Displays Right Extensions R3 to S3 + the pivot point
TF2 Displays only Right Extensions R2 to S2
I would have liked to have provided more Right Extensions plus Labels however that would have exceeded Tradingviews memory limits, having said that R3 to S3 for both timeframes can still be displayed as historical levels
Central Pivot Range High Low and Mid Levels + the Targets work great as Support and Resistance and help with analysing the trend
A Thick Central Pivot Range generally indicates consolidation whereas a Thin Central Pivot Range generally indicates a trending market

[MF] CURRENT AND NEXT CPR LEVELSThis is CPR with Monthly, Weekly and Daily time frames of the current and next* CPR levels.
* The following lines only become relevant at the end of the cycle.
CPR LEVELS:
P (pivot point) = (H + L + C) / 3
BC (Bottom Central) = (H + L) / 2
TC (Top Central) = (P - BC) + P
Resistance Levels
- Green = R1 Levels ( 2×P - L )
- Green = R2 Levels ( P + (H - L) )
- Green = R3 Levels ( H + 2 * (P - L) )
Support Levels
- Red = S1 Levels ( 2×P - H )
- Red = S2 Levels ( P - (H - L) )
- Red = S3 Levels ( L - 2 * (H- P) )
Description and Refrences:
en.wikipedia.org(technical_analysis)
Rules For BUY Setup with CPR
1) Today's Pivot Level Should be higher than Previous Day's Pivot Level
2) The previous day's close should be near day high.
Rules For SELL Setup with CPR
1) Today's Pivot Level Should be lower than Previous Day's Pivot Level
2) The previous day's close should be near day low.
CPR or central pivot range is the best tool available for the trader to see the price base indicator. You can use this tool i.e CPR (central pivot range) to check the price indicator in the stock market. You know the price of shares sometimes goes up or sometimes goes down in the stock market. So it will be best to stay updated and know it before the time the share market/stock market fall or rises.

Central Pivot Ranges & Pivot based BarcolorsThe Central Pivot Range derived from the pivot of a defined higher timeframe is the considered by some traders as the bread and butter levels of the market for a reason.
A combination of 3 CPRs from different timeframes can provide you with some some more insight into the assets your analysing and might offers you some more confidence in performing your trades.
This script also offers you an extensive amount of options like:
- The option to look at current or developing CPRs.
- A resolution selector
- Options to hide and show Tops Bottoms and Pivots seperately
- Color selectors depending on the close price up or down the pivots
- And an option to colorize your candles by pivots crossed.

PivotZoneTradesThe Indicator shows daily CPR level (3-dotted) lines. It also shows H3 and L3 Camarilla Pivots (Red and Green Dotted Lines). VAH and VAL value areas are shown by silver lines. 200 and 20 simple moving averages are also included in the indicator. RBI (R) and GBI (G) Red and Green Ignored Bars of Mr. Oliver Velez are also shown in this indicator. Various candlestick alerts as mentioned in the book "Secrets of Pivot Boss" are shown in Red and Green Up/Down triangles. Range Breakouts are shown in blue coloured triangles. Dotted purple line is Weekly Pivot Line. It is advised to follow proper risk-management rules when using any of the strategy/ indicator published by others.
Disclaimer: This indicator is to be used only for educational purpose. Signals shown in this indicator are not buy/sell recommendations.

CPR by WsrWe recommend some preconditions for Intraday Trading Strategy with CPR (Central Pivot Range)
Rules For BUY Setup with CPR
1) Today's Pivot Level Should be higher than Previous Day's Pivot Level
2) The previous day's close should be near day's high.
Rules For SELL Setup with CPR
1) Today's Pivot Level Should be lower than Previous Day's Pivot Level
2) The previous day's close should be near day low.
CPR or central pivot range is the best tool available for the trader to see the price base indicator. You can use this tool i.e CPR (central pivot range) to check the price indicator in the stock market. You know the price of shares sometimes goes up or sometimes goes down in the stock market. So it will be best to stay updated and know it before the time the share market/stock market fall or rises.
CPR by PIVOT EDGEIntroduction to the Indicator "CPR by PIVOT EDGE - with AUTO BUY SELL Triggers"
The Foundation layout for this indicator is based on PIVOT's strategy which are nothing but the most important levels that the price has respected in the past. The values for the pivots are derived from the key attributes of the price in any timeframe such as the previous OPEN, HIGH, LOW and CLOSE. These define the mood of the price and where it intends to move in relation to the previous range formed. Earlier HIGH - LOW i.e the RANGE indicates the possible movement that a stock can make in the current session and as per the calculated pivots we can possible find out the tentative supports and resistances. In addition to this indicator, It is advisable to use the price action theory which helps in taking a right decision for entries.
This indicator by itself is complete in nature, i.e it guides the user for possible entry levels and the projected targets that we can achieve and also the likely stop loss limit in case the price reverses. So beforehand even before entering into a trade position, the user can ascertain what can be his loss or max profit and then he can chose an optimum position size for favorable results. This Indicator also comes with labels for all PIVOTS like CPR , TC , BC , S1,R1, PDH , PDL etc.. which makes it easier to understand levels and trade
The beauty of this Indicator lies in the fact that it can be used for all types of trading styles like Scalping, Intra day, Swing or Positional and Investments also. It works on all timeframes and across all market segments like EQUITY, COMMODITIES , FUTURES , FOREX etc. This indicator can be used for any exchange and any time zone also without any changes or adjustments needed.
Now let us understand the features of this Indicator in detail.
TIMEFRAME - It has options to choose between Day, week and month as timeframe. By default it is set to Day timeframe - Though this Indicator works on all timeframes, it is advisable to work on ,15,30 mins Intraday and 1H,2H, 4H for Swing and D,W candles for Positional trades.
DISPLAY CPR BAND - This displays the CPR range that consists of Pivot , TC and BC . This Band or Range is the core of this indicator and this gives a detailed information about the tentative range and momentum of the market for the present period
as well a prediction for next session and also can tell you the history of its prior period. This level acts as both support and resistance based on the direction of the trend. The unique feature built in this indicator is that
the CPR Band changes its color based on whether it is ascending or descending CPR or in other works if it is higher value relation or lower value relation compared to previous session. Green for Higher and red for lower relation.
DISPLAY SUPPORT RESISTANCE - This indicates the important support and resistance levels for the day which is derived from the price details of prior period that is based on HIGH / LOW / CLOSE of prior period.
DISPLAY PREVIOUS HIGH / LOW / CLOSE - I have included Daily / Weekly. It is important to know the earlier highs / lows and close since price respects it very much just like support and resistance .
DISPLAY TOMORROW CPR - This displays the CPR band and support / resistance for tomorrow. It give an advance information of tomorrows trend and momentum today itself if you study the CPR concepts you can be prepared for tomorrows' market and can very well know in advance if it will be a sideways market or a trending day.
PMA - Pivot Moving averages are an important combination of 3 Fibonacci series based moving averages. Here I have used 9,14 & 23 as the series which I found gave best results after long period of back testing and finetuning. It clearly gives you the mid term trend of the price and if you just follow the color of the band then you wont go wrong. Always try to take entries whenever price finds support or resistance close to the curve and avoid taking entries whenever price is too far from these curves.
These curves and the area are also color coded to depict buying and selling zones.
MAJOR TREND - This displays the prevailing major trend in the market and I have used as 200 period moving average by default which you can change to suit your needs. You can check the major trend of the market by using higher timeframes above 1Hr.
MARKET BIAS INDICATOR - One more unique feature of this Indicator is the background color which denotes on which medium trend currently the market is i.e whether Buying is favorable or selling is favorable. Light blue if for Buying zone and Light yellow is for selling zone.
BUY SELL triggers - This is going to be the most unique and advanced feature of this indicator. I have carefully studied and created a special trigger system which will alert the user whenever a BUY or SELL opportunity is presented in the stock. This is the result from a lot of study of the pivot strategies, CPR techniques, Price action theory, Candle stick patterns , market structure and my trading experience all put together. You can set the automatic alerts to any number of stocks to whichever timeframe you prefer either for Intraday or even swing & positional trading. ( Depends on the type of Trading view account you hold). Please note that this Indicator trigger's works even for the free trading view account and you do not need paid version.
Color classification - Buy triggers bars will be colored in Parrot green or Lime green color, Sell triggers bars will be colored in pink color. Regular Bullish and bearish candles will remain as Green and red.
ALERTS - I have coded automatic alert system in trading view and named them as ENTRY SIGNALS. You can add alerts to any of the stocks at whichever timeframe you prefer so that whenever there is a BUY or a SELL condition met, you will get notification or Desktop / Mobile app / Email etc.
IMPORTANT NOTE : This indicator does not guarantee any favorable results nor protect your from any loss. You own the complete risk of your trades. It is suggested that you use this indicator and do back testing for considerable period to understand how it works the the potential win rate it can give.

Dynamic Pivot Box for Month and YearThe basic idea of the ‘Dynamic Pivot Box’ is to show only the Pivots that are closer to the Price. This is, the nearest pivots acting as support and resistance; thus hiding all other pivots which are further away from the price and also hiding the pivots from previous periods… Pivots will be hidden until price breaks out from the current box and moves to the next one. Hopefully, with this change you can focus more on the actual price action/ price patterns on the chart rather than on several/ noisy lines on the screen.
**Please note that the recommended use for this indicator is on the daily or higher timeframes if you want to see Year pivots... Monthly pivots can be still seen on the hourly chart, but I am afraid that lower timeframes will not plot the indicator properly.**
The Pivots are taken from Frank Ochoa’s book ‘Secrets of a Pivot Boss’, so if you are not familiar with them, I would recommend you to first take a look at the theory behind them.
The Pivots in this indicator are divided in two groups: ‘Standard pivot’ and ‘Camarilla’ pivots.; and then this latter is group is divided in two also: the ‘Main Camarilla’ and ‘Regular Camarilla pivot’. You can select which groups of pivots are taken into account for the ‘Dynamic Pivot Box’.
If you decide to select all Three Groups: ‘Standard Pivot’, ‘Main Camarilla’ and ‘Regular Camarilla pivot’ you will see ALWAYS 4 pivots surrounding the price. My recommendation is to select only ‘Standard Pivot’ and ‘Main Camarilla’ so that you see only between 2-3 pivots on the screen. This recommended view is actually the default settings.
In addition, if you want to further reduce noise from the chart, you can unselect the ‘Lines’ option within the SETTINGS/ STYLE menu.
What you see on the chart/sample is actually this indicator plotted twice:
1. Year Pivots which have the default settings and are shown as white ines
2. Month Pivots have also the default settings BUT I also selected the option ‘Previous Pivots’ to show the pivots from previous period , and also I unselected the ‘Lines’ options as mentioned above to reduce noise.
You are more than welcome to enhance the current version, my only ask is to please share the enhanced version back with the community. I wish I could make amends or modify the current version myself but I actually just came up with the idea and I paid a coder in Fiverr to develop it.

CPR Strategy - (Call and Put Option Selling)The strategy is designed using CPR and Donchian Channels.
STRATEGY RULES:
We need to wait for "Sell Call" or "Sell Put" arrow on the chart.
Sell call or put on the next candle.
Sell call strike above CPR resistance and candle close above it will be stop loss.
Similarly, sell put strike below CPR support and candle close below it will be stop loss.
This strategy is purely based on theta decay principle.
Hence, always use this strategy on weekly option.
Also, never trade on Monday or Friday to avoid volatility.
Hope you enjoy this strategy and become a professional trader.
Enjoy! :-)
Drop your message below if you have any doubts. Thanks.

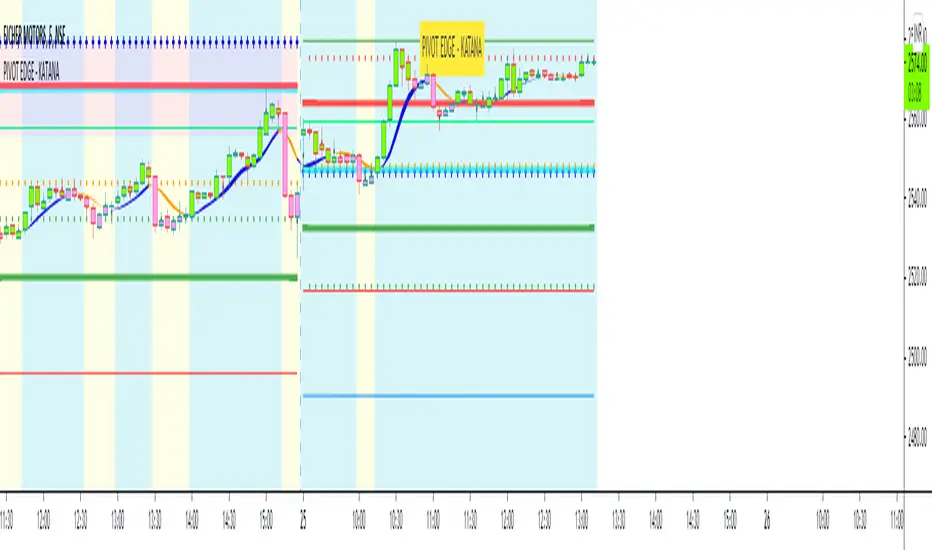
PIVOT EDGE - KATANAIntroduction to the Indicator " PIVOT EDGE - KATANA " . Katana means the sword in Japanese that the legendary samurai warriors used which was sharp , swift and strong to take on any opponent and gave an edge to win. This Indicator also has some of the unique features and hence it is aptly named so.
The Foundation layout for this indicator is based on PIVOT's which are nothing but the most important levels that the price has respected in the past. The values for the pivots are derived from the key attributes of the price in any timeframe such as the OPEN, HIGH, LOW and CLOSE. These define the mood of the price and where it intends to move in relation to the previous range formed. Earlier HIGH - LOW i.e the RANGE indicates the possible movement that a stock can make in the current session and as per the calculated pivots we can possible find out the tentative supports and resistances. In addition to this indicator, It is advisable to use the price action theory which helps in taking a right decision for entries.
This indicator by itself is complete in nature, i.e it guides the user for possible entry levels and the projected targets that we can achieve and also the likely stop loss limit in case the price reverses. So beforehand even before entering into a trade position, the user can ascertain what can be his loss or max profit and then he can chose an optimum position size for favorable results.
The beauty of this Indicator lies in the fact that it can be used for all types of trading like Scalping, Intra day, Swing or Positional and Investments also. It works on all timeframes and across all market segments like EQUITY, COMMODITIES , FUTURES , OPTIONS , FOREX etc.
This indicator can be used for any exchange and any time zone also without any changes or adjustments needed.
Now let us understand the features of this Indicator in detail.
TIMEFRAME - It has options to choose between Day, week and month as timeframe. By default it is set to Day timeframe
DISPLAY MAJOR LEVELS - These are the important support and resistance levels calculated based on the past price data. Most important ones are marked in BOLD RED and BOLD GREEN between which the price tends to move generally.
Apart from these, We have breakout level marked in light green and if price breaks this level we can expect targets upto extended levels and beyond marked in blue.
we also have breakdown level marked in light red and if price breaks this level we can expect targets down up to extended levels and below it marked in blue.
DISPLAY HIDDEN LEVELS - These levels are intermediate supports and resistances that can be used whenever the present day indicated range is very wide. Whenever we have an explosive moments in market the range of that day is very huge and so he next day support and resistance band becomes very wide indicating the sideways movement day within that range. And on those days we can switch on the hidden levels and the price respects these levels and most of the days it is inside this range only.
DISPLAY PREVIOUS HIGH / LOW / CLOSE - I have included Daily / Weekly levels. It is important to know the earlier highs / lows and close since price respects it very must just like support and resistance .
MID OF PEMA - This is an important EMA based indicator which potentially indicates curves of support and resistance during retracements or pullbacks. If the curve is breached then the trend is reversed and the price will tend to move to the next pivots . You can use this as trailing stop loss.
CPR - Central Pivot range, An Important tool for the CPR purists. I am using this particular CPR , TC , BC Band as a colored band indicating whether it is ascending or descending bias. The Band color is GREEB when the CPR is ascending up compared to yesterday and RED when is descending. By the width and narrowness of CPR you can ascertain the trading range and this information is available right after the market close so that you can plan your trades for tomorrow.
SENTIMETER LINE - Gives you a glimpse of the market sentiment at the pre open. Based on this you can know if there is a shift in the sentiment of Buyers / sellers and if price is accepted or rejected. This level acts as an important support / resistance level.
VWAP - Volume weighted average price , One of the widely used and maybe the only Indicator used on charts by most pro traders and big institutions. It gives you an Idea of the volumes that are getting traded in huge quantity and will act as a magnet attracting and also repelling price.
CANDLE MID POINT - This is small feature that's is very important but gets ignored because of lack of knowledge or awareness by traders. Most of the times the mid of the explosive or momentum candles becomes the last line of defense for Buyers / sellers and you can see the battle happening exactly at this point.
THE TURNING POINT - As the name suggests, most of the times price gets turned away from this because lot of fresh and unfilled orders are waiting to be executed at this level. So it becomes an important profit booking or fresh entry level
SCALPERS MAGIC CURVE - This is a high speed curve which has zero lag and very dynamic in nature which reacts quickly to the change in price. Go long when it is trending up and Blue in color, close trade when it turns orange and makes a U turn and vice versa. Most suited for scalpers who trade in 2 to 5 mins time frame. When you want to use this, switch off all other below parameters.
SMART RIBBON - The best and the new unique feature of this curve. As compared my other previous Indicators which had PEMA curve as the base for trend Identification, Here i am introducing this ribbon concept which is much faster reacting to the change in trend and gives you very early entry and also early exits so that you can get the maximum gains from the trend. In a way you can catch the fall right from the start till the end and exit at the end of the trend. Blue for uptrend and Orange for Downtrend.
MARKET BIAS INDICATOR - Again one more unique feature introduced in this Indicator. This feature will paint the chart background in Light blue for BUY ZONE And light yellow for SELL ZONE. You can look to BUY or SELL based on the background color and hence it prevents you from entering trade in wrong or opposite direction. You can avoid trade when there is too much crisscross of colors indicating sideways or range bound market.
BUY SELL TRIGGERS - This features is built on smart logic based on price action / Candle patterns / pivots and my trading experience. It colors the candle bars into LIME GREEN / PINK whenever Buying / Selling opportunities are seen. This is also paired with the alert system which can be used to set automatic sound and desktop notifications. Based on the type of account you hold in trading view you can set alerts for upto 400 stocks.
SMART CANDLE COLORING - If you don't want to do the work of finding the trend and looking for right entry location and exit levels, then you can simply use this feature which makes trading look so simple and easy. This is like an AUTO PILOT mode or CRUISE mode where it colors the candles in only BUY ZONE color ( LIME GREEN ) or SELL ZONE color ( PINK ). Take entry above the high of the first candle and be in the trade as long as you see the opposite color. When you want to use this feature, switch off the BUY SELL TRIGGER.
It is advised that you first learn how this indicator works by back testing historical data and also forward testing in live market by way of paper trading before you deploy real money.
IMPORTANT NOTE : This indicator does not guarantee any favorable results nor protect your from any loss. You own the complete risk of your trades. It is suggested that you use this indicator and do back testing for considerable period to understand how it works the the potential win rate it can give. If you have any doubts or need any clarifications of assistance in understanding, you can message me and I will try to help.
Happy and Safe trading - Mohan from PIVOT EDGE
Contact for getting access to this Indicator. Send a personal message on trading view or on my whatsapp no 9353160775
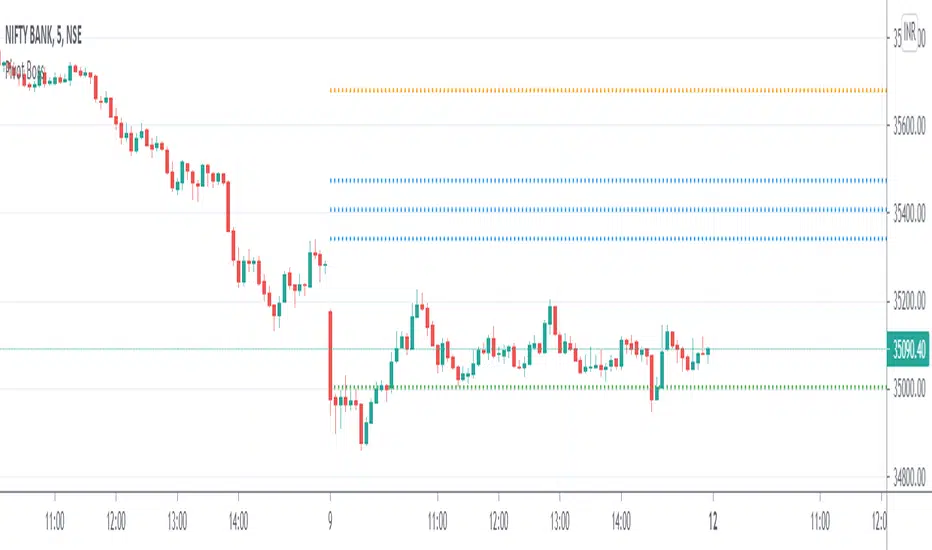
PriceCatch Opensource CPRHi Friends & TradingView community.
Greetings to you.
Some traders like to use Central Pivot Range (CPR) in their chart for assessing price movement. It is usually used in combination with Pivot Levels.
Calculating CPR is a simple matter. There a few CPR scripts in the Public Library, but have the code hidden. I thought there may many users who may want to know how CPR is calculated and study it for use in their own scripts. So, here is the CPR script with the code. Use it as you please.
Note: CPR is plotted only on intra-day time-frames.
The light magenta (band) range is current day CPR.
The light blue (band) range is tomorrow's CPR projected for you today itself based on current day's price action and range.
Queries / feedback welcome.
All the best.
PS: The script is developed to the best of my ability and as with all indicators, you have to decide if it might be useful to you when adding to your chart.

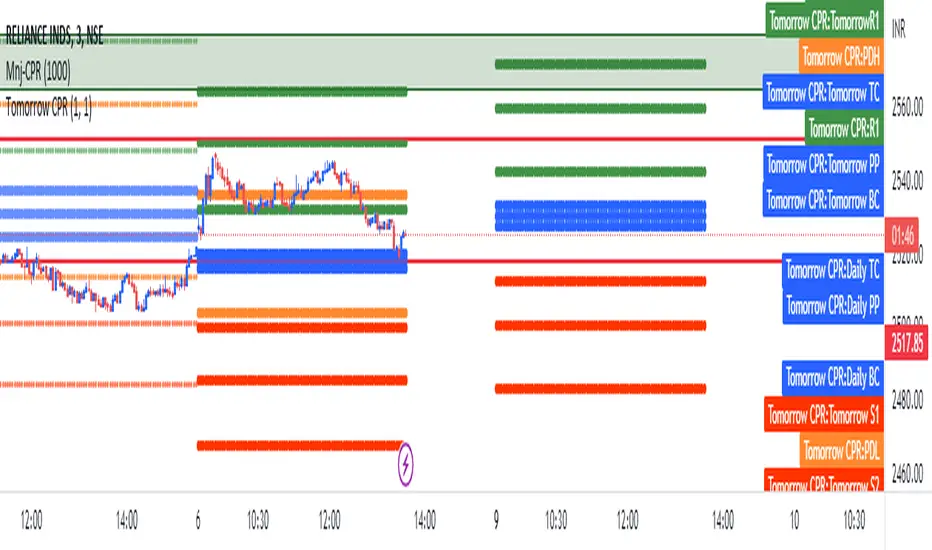
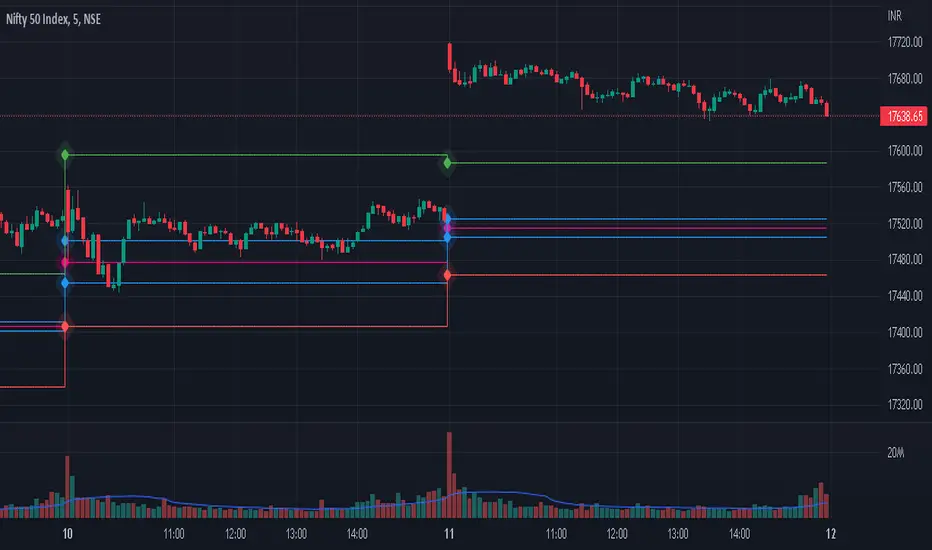
Pivot Boss - CPRThe Central Pivot Range (CPR) is used to identify key price points to set up trades. CPR is beneficial for intraday trading. This indicator can plot:
1. Daily Pivots and Daily Support/Resistance
2. Tomorrow Pivots and Support/Resistance
3. Weekly Pivots and Weekly Support/Resistance
4. Monthly Pivots and Monthly Support/Resistance
5. Previous Day High/Low
6. Previous Week and Month High/Low
Intraday Trading ZonesThis script can help in intraday trading. It can plot
1. Previous day high, low and close.
2. Intraday Fibonacci levels
3. Big Round Numbers
3. CPR (Central Pivot Range)
4. VWAP
