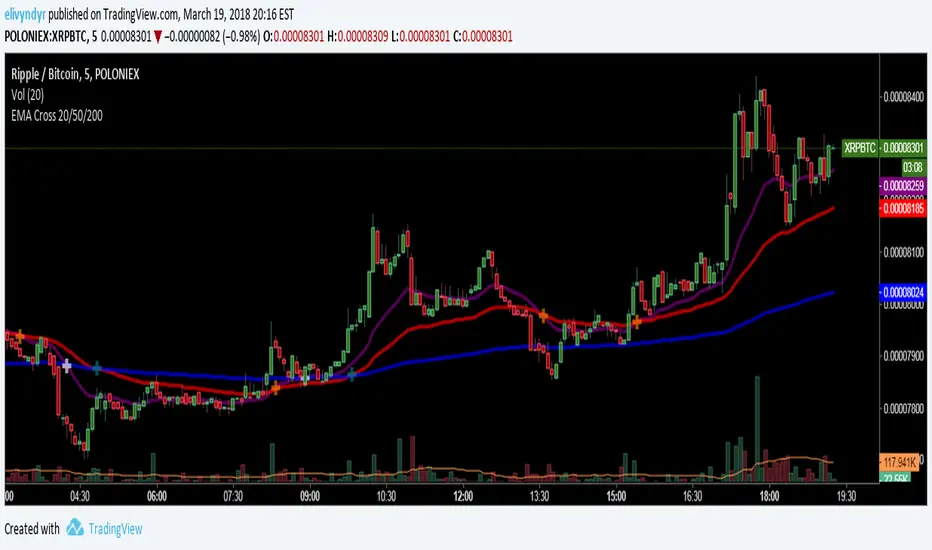
EMA Cross 20/50/200Added a 20 EMA cross to the avaiable 50/200 EMA Cross script in the public library
Crossover
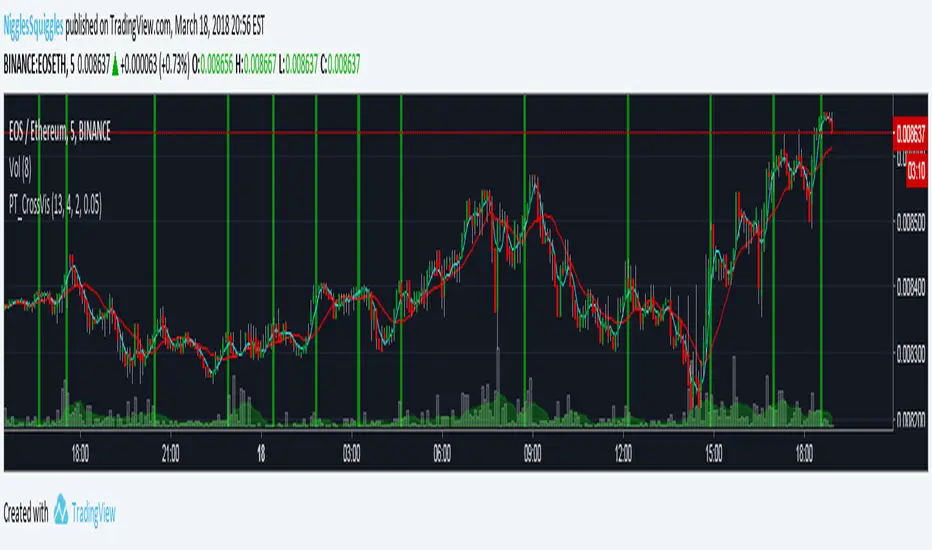
PT_MA Cross VisualiserThis indicator is designed for use with Profit Trailer's CROSS strategies.
The user can select either EMA or SMA averages and input their own buy value settings.
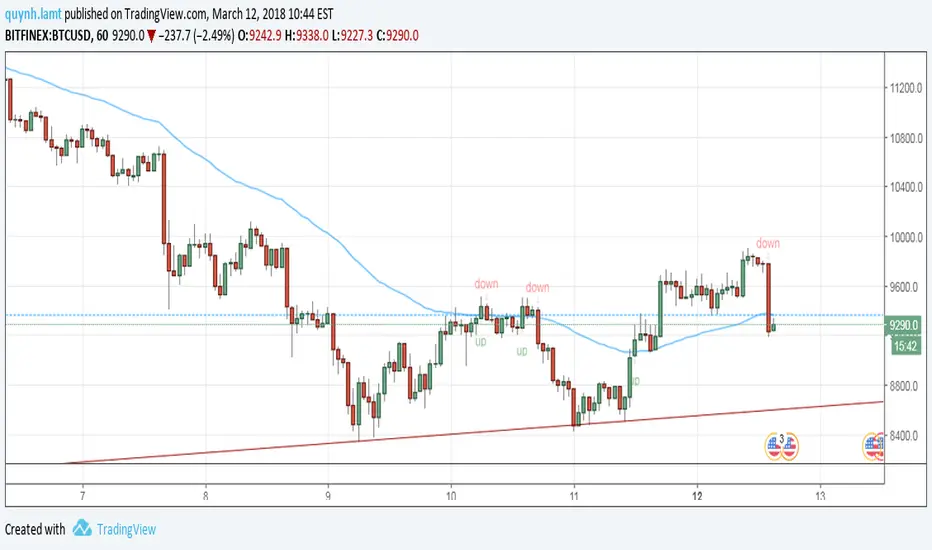
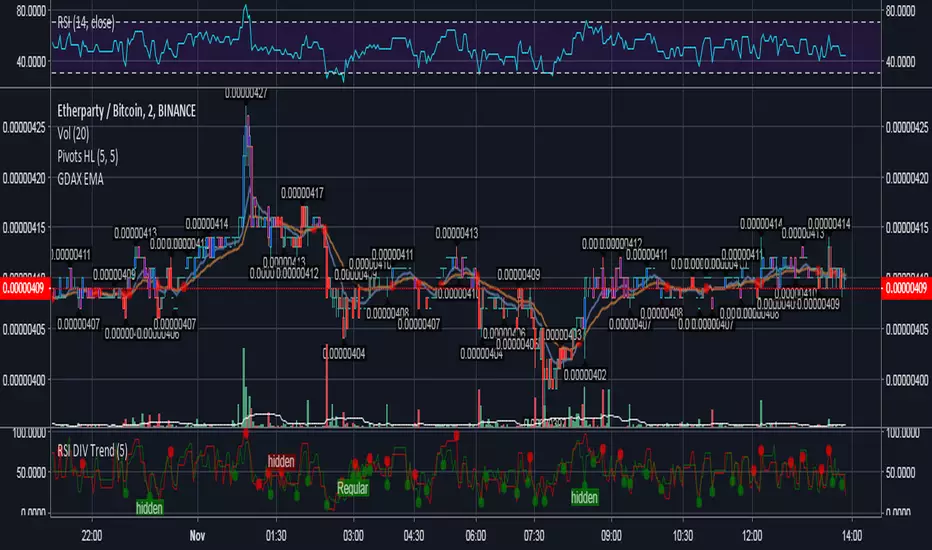
GDAX EMA Cross[26,12]This indicator allow to show the EMA of the price similar to GDAX user interface.
The purpose of this indicator is twice:
Allowing the user to show a double EMA with the possibility to show when a EMA crossing happens.
Showing in a more user friendly interface the GDAX ema line.
As a matter of fact is proven that those 2 EMA act as support/resistance during Bulls/Bear periods. The indicator works fine in the GDax timeframes, or rather 5m, 15m, 1h and daily excluding 3h and 6h as they're less used at the moment.

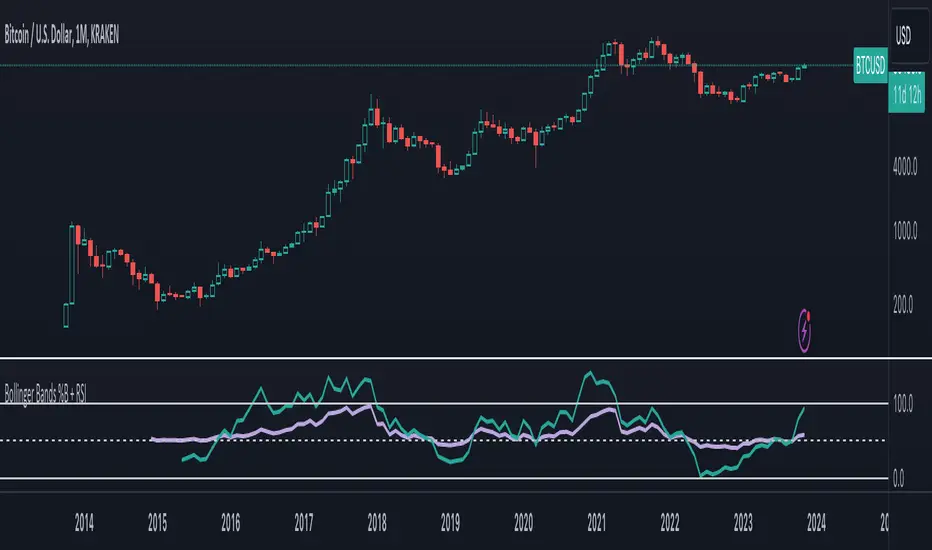
Bollinger Bands %B + RSIBollinger Bands %b and RSI in one, and a experimental RSI cloud based in BB formula.
RSI scale goes from 0.00-1.00 instead of 0 -100.
TRIX Histogram R1-12 by JustUncleLCreated by request.
Description:
This study is an implementation of the Standard TRIX indicator (a momentum oscillator), shown in coloured histogram format by default, with optional Bar colouring of TRIX zero cross overs. Other options include showing TRIX as a line graph instead of histogram and an optional TRIX signal line with difference histogram (to highlight signal line crosses).
References:
forex-indicators.net
"TRIX MA" by munkeefonix


Intraday - Exponential Moving Average 3 CrossOverA Simple EMA crossover strategy for intraday traders.
A Buy signal is triggered when a green arrow is followed by a blue arrow.
A Sell signal is triggered when a red arrow is followed by a purple arrow.
To remove false positives, combine this with other indicators.

EMARCOThis is the study of the ratio of the MACD exponential moving averages, 0.993 and 1.003 were used to define the overextended positions since this is the highest the oscillator usually goes, price tends to reverse when overextended. RE1 (ratio equation 1) = the fast Exponential Moving Average (12 points) divided by the slow Exponential Moving Average (26 points) and RE2 is reciprocal. Here we see that when the RE1 is greater than RE2 price tends to drop and so when the opposite is true

[INDICATOR]Renko Emulator OCC v1 by JustUncleLThis "Study" project has been created by request and is used in conjunction with the "Strategy" version.
*** EXPERIMENTAL ***
*** USE AT YOUR OWN RISK ***
Description:
Indicator based around Renko Bar Chart emulator (ATR) with direction change used to signal buy/sell trades.
I have generally found that setting the strategy ATR resolution to 3-5x that of the chart you are viewing tends to yield the good results, regardless of which chart time used. Positions get taken automatically following THE Renko Bar after a crossover.

Triple Guppy CrossGUPPY MULTIPLE ESTIMATED MOVING AVERAGE (EMA) is for Trend Trading. This script uses three sets of crosses to give us an indicator of possible trend reversal. Red cross is the first alert, followed by blue and black. Black cross being the strongest, red cross weakest.
More information about Guppy Trading can be found in the link below

Trend MA 20Simple to use for anyone trading a 20 length moving average.
Crossover is signaled once 20 MA crosses 1 MA at close of selected time interval.

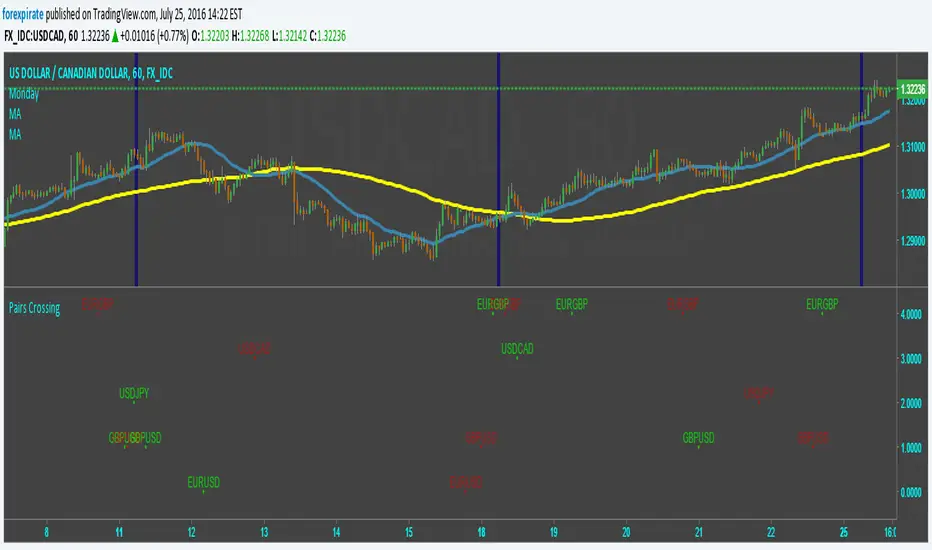
Pairs SMA Cross Over/UnderIndicator shows when a pair's SMAs cross-above or cross-under. You pick the pairs by changing the s#-corresponding to the p# matching the pair you want. The other variable numbers are out of order but it doesn't matter expect to the look of the script.
Indicator420double hull moving average crossover
hull moving average / volume weighted moving average crossover
Red dot = SELL
Green dot = BUY
or
Longest MA color change to green = BUY
Longest MA color change to red = SELL
by SeaSide420

RN MACD SignalsThis is my simple way to quickly see MACD signals without having the MACD taking up space. The one at the bottom is for display to show how this works. A crossover occurs when the arrow flips over. The position of the arrow tells you if it is currently above or below the zero line. You can change the script to overlay and have it show up above or below price also. Let me know what you think.

Ichimoku-Hausky_v2.1Made a little update to my trading system. This system is made so that you can easily follow the trend and know when to get out. You still have to know basic market structure to find a good entry.
NB!! I see that i placed the entry wrong on the example, you have too wait for the EMA to go below the MA :)
I have posted the right one at the bottom.
Take profit can be set at last low or you can use trail stop on the EMA, MA, Kijun-sen or Tenkan-sen.
Example rules:
Buy:
IF Market is in a trend or are possibly close to break out of range
THEN see if price has closed above cloud
IF price has closed above cloud
THEN see if EMA has crossed above MA
IF EMA has crossed above MA
THEN buy or wait for pullback
Sell:
IF Market is in a trend or are possibly close to break out of range
THEN see if price has closed below cloud
IF price has closed below cloud
THEN see if EMA has crossed below MA
IF EMA has crossed below MA
THEN buy or wait for pullback

Ichimoku-Hausky_v2 Trading SystemMade a new version of my trading system. I have added a cloud that is made with 45 EMA and 104 MA. Now you can choose where to set trailing stop. As shown in the example you set trailing stop under the cloud.

Ichimoku-Hausky Trading systemThis is a indicator with some parts of the ichimoku and EMA. It's my first script so i have used other peoples script (Chris Moody and DavidR) as reference cause I really have no idea myself on how to script with pinescript.
Hope that is okay!
I use 20M timeframe but it should work with any timeframe! I have not tested this system much so I would really appreciate feedback and tips for better entries, settings etc..
Tenken-sen: green line
Kijun-sen: blue line
EMA: Purple
Rules:
Buy:
IF price crosses or bounce above Kijun-sen
THEN see if market has closed above EMA
IF Market has closed above EMA
THEN see if EMA is above Kijun-sen
IF EMA is above Kijun-sen
THEN buy and set trailing stop 5 pips below EMA
Sell:
IF price crosses or bounce below Kijun-sen
THEN see if market has closed below EMA
IF Market has closed below EMA
THEN see if EMA is below Kijun-sen
IF EMA is below Kijun-sen
THEN sell and set trailing stop 5 pips above EMA

[RS]Moving Average Cross System V0moving average crossover with added functions:
if you want crossover with price set ma1 length to 1, or use as dual ma with both lengths, ability to turn ma's on and off leaving the crossover signals behind, ability to chose ma mode (sma, ema, rma, wma, vwma, swma and alma), ability to chose source (open, high, low, close, hl2, hlc3 or ohlc4).

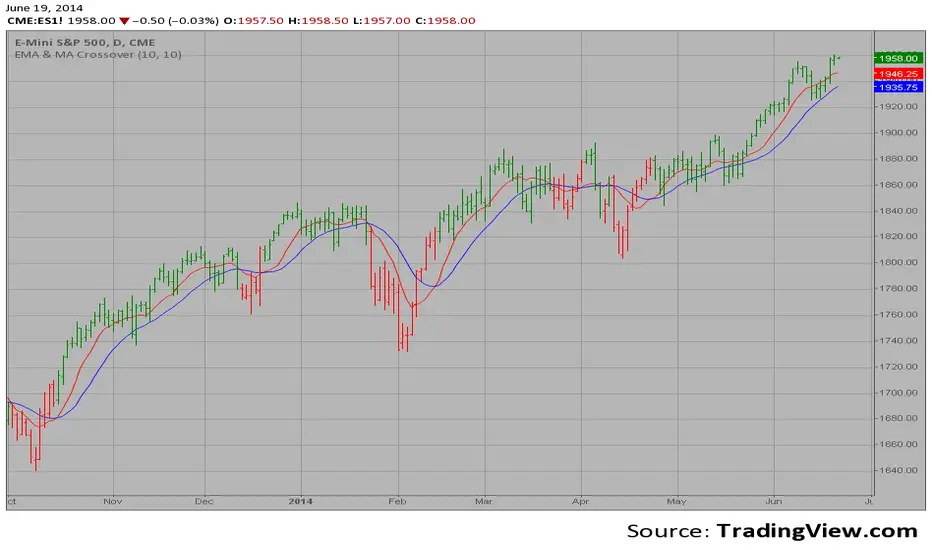
EMA & MA Crossover The Moving Average Crossover trading strategy is possibly the most popular
trading strategy in the world of trading. First of them were written in the
middle of XX century, when commodities trading strategies became popular.
This strategy is a good example of so-called traditional strategies.
Traditional strategies are always long or short. That means they are never
out of the market. The concept of having a strategy that is always long or
short may be scary, particularly in today’s market where you don’t know what
is going to happen as far as risk on any one market. But a lot of traders
believe that the concept is still valid, especially for those of traders who
do their own research or their own discretionary trading.
This version uses crossover of moving average and its exponential moving average.
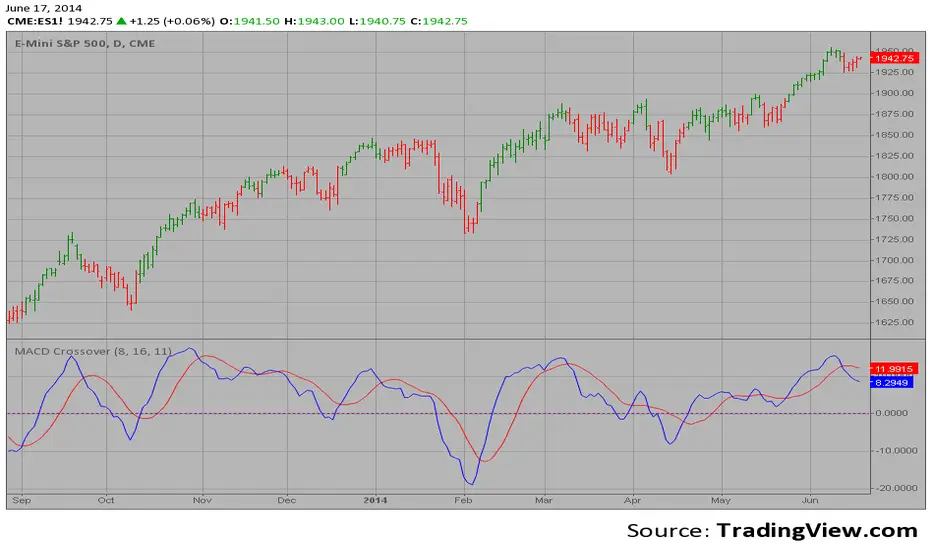
MACD Crossover MACD – Moving Average Convergence Divergence. The MACD is calculated
by subtracting a 26-day moving average of a security's price from a
12-day moving average of its price. The result is an indicator that
oscillates above and below zero. When the MACD is above zero, it means
the 12-day moving average is higher than the 26-day moving average.
This is bullish as it shows that current expectations (i.e., the 12-day
moving average) are more bullish than previous expectations (i.e., the
26-day average). This implies a bullish, or upward, shift in the supply/demand
lines. When the MACD falls below zero, it means that the 12-day moving average
is less than the 26-day moving average, implying a bearish shift in the
supply/demand lines.
A 9-day moving average of the MACD (not of the security's price) is usually
plotted on top of the MACD indicator. This line is referred to as the "signal"
line. The signal line anticipates the convergence of the two moving averages
(i.e., the movement of the MACD toward the zero line).
Let's consider the rational behind this technique. The MACD is the difference
between two moving averages of price. When the shorter-term moving average rises
above the longer-term moving average (i.e., the MACD rises above zero), it means
that investor expectations are becoming more bullish (i.e., there has been an
upward shift in the supply/demand lines). By plotting a 9-day moving average of
the MACD, we can see the changing of expectations (i.e., the shifting of the
supply/demand lines) as they occur.
Strategy Stochastic Crossover This back testing strategy generates a long trade at the Open of the following
bar when the %K line crosses below the %D line and both are above the Overbought level.
It generates a short trade at the Open of the following bar when the %K line
crosses above the %D line and both values are below the Oversold level.
