العملات الرقمية


MTF Deviation - Mtrl_ScientistHi everyone,
There are a lot of possible ways to look at markets and find valid patterns.
This time, I've looked at how shorter time frames deviate from the overall price consensus.
What you're seeing here is a range-bound difference of the lowest time frame from the overall price consensus (baseline), represented as blue line.
When lower time frames agree with the baseline, the difference becomes 0.
Logically, this difference cannot deviate too much from the baseline, and to quantify that, I've added fib-levels based on a deviation percentage that depends on price volatility and can be adjusted in the settings.
How it works:
First of all, you need to switch to the 1min time frame to get access to the lowest time frame data.
Look at how the blue line follows the support/resistance fib levels.
Oversold conditions are usually given by entering the lowest red band, whereas overbought conditions are given by entering the upper red band.
However, there are also extreme cases, where the blue line exceeds the set fib levels. In that case, price will reverse with very high likelihood.
Alternatively you can also ping-pong between two fib levels for frequent small trades.
Note that this indicator doesn't use any security functions to access time frame data. Instead, I found a different way to avoid repainting.
At the moment I'm just playing around with this to see how I can improve it. Feedback is very welcome!

[CR] BTCLONG_SHORT MTF RSI DIVComparing BTCLONG and BTCSHORTS RSI on BITFINEX
+MTF
+RSI
+Difference
Simple indicator to show long/short contract association, including relative difference.

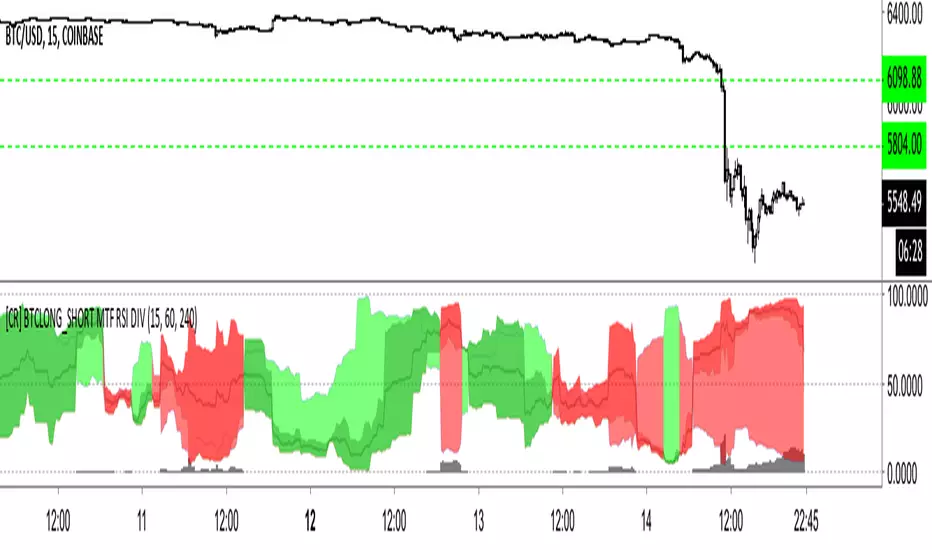
[CR] BTCLONG_SHORT MTF RSI DIV+ MTF x 3 BTCSHORT and BTCLONG on BITFINEX RSI
+ SHORT vs LONG RSI + Difference
This indicator demonstrates the difference between BTCLONG and BTCSHORT values on BITFINEX and compares their relative difference also in RSI.
Red = SHORT > LONG
Lime Over Green = LONG > SHORT difference RSI greater than LONG vs SHORT RSI.
Red Over Darker Red = SHORT > LONG difference RSI greater than SHORT vs LONG RSI.
Black trend line = Total SHORT/LONG RSI
Grey Columns = Total RSI / Difference RSI
TradingLive24 System EOSUSDThis is a script for EOSUSD in 5 minutes resolution.
It will show you when you must to Buy, Sell or Exit from the Crypto.
The strategy has 80% of success. You can modify and adapt it to your requirements.
If you want to have more entries, you only need to modify the parameters 3 and 4, preferably with values less than 20.
Usually, the parameter 4 need to be grater than parameter 3.
The parameters 1 and 2 don't need to be modified, but you can touch them too.
Also, the TakeProfit1 and StopLoss1, usually are greater than TakeProfit2 and StopLoss2.
If you want more percent of success, you can modify the TakeProfit with a smaller number.
Get 10-day Free Trial, just send us your TradingView Username here www.tradinglive24.com

TradingLive24 System LTCUSDThis is a script for LTCUSD in 5 minutes resolution.
It will show you when you must to Buy, Sell or Exit from the Crypto.
The strategy has 80% of success. You can modify and adapt it to your requirements.
If you want to have more entries, you only need to modify the parameters 3 and 4, preferably with values less than 20.
Usually, the parameter 4 need to be grater than parameter 3.
The parameters 1 and 2 don't need to be modified, but you can touch them too.
Also, the TakeProfit1 and StopLoss1, usually are greater than TakeProfit2 and StopLoss2.
If you want more success percent, you can modify the TakeProfit with a smaller number.
Get 10-day Free Trial, just send us your TradingView Username here www.tradinglive24.com

TradingLive24 System ETHUSD This is a script for the ETHUSD in 5 minutes resolution.
It will show you when you must to Buy, Sell or Exit from the Crypto.
The strategy has 80% of success. You can modify and adapt it to your requirements.
If you want to have more entries, you only need to modify the parameters 3 and 4, preferably with values less than 20.
Usually, the parameter 4 need to be grater than parameter 3.
The parameters 1 and 2 don't need to be modified, but you can touch them too.
Also, the TakeProfit1 and StoppLoss1, usually are greater than TakeProfit2 and StoppLoss2.
If you want more success percent, you can modify the TakeProfit with a smaller number.
Get 10-day Free Trial, just send us your TradingView Username here www.tradinglive24.com

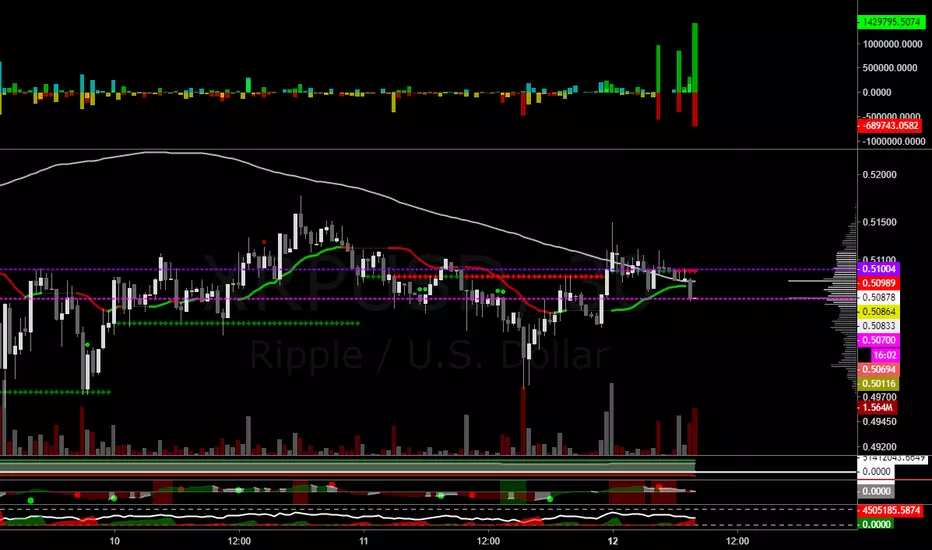
Bitfinex Margin ΔShows long/short position changes per chart period
Works for all Bitfinex margin pairs
Red = Short Open
Yellow = Long Close
Cyan = Short Close
Green = Long Open
CryptoMedics Algorithmic Trading Bands CryptoMedics are happy to announce the release of our new Algorithmic trading bands!
The Bands are used as dynamic moving support and resistance levels and can be used for anything from scalping on low timeframes to swing trading larger moves.
An example of this would be if a coin pumped 20% and you're expecting it to go up more you wait for it to return to either the upper middle or one of the core bands and long it there.
The amount of usecases for this indicator is endless.
Developed using tried and proven methods that everyone from private individuals to wallstreet hedge funds have used. Now available to CryptoMedics subscribers.
The indicator works across any assets since it isn't based on any pair-specific data but rather more broad data that exists on all trading pairs.

Bitfinex Longs/Shorts Ratio AlertableThis script contains Bitfinex longs/short ratio and generates alarms with a given input .default value is 60 which means alerts when either shorts/longs reach 60:40 ratio

Ninja EMA Cross 5/8/13This is a short term EMA cross which is used primarily used for the 1HR chart and below perfect for highly volatile markets . Color coded for clear signals and easy to read crossovers strategy. I recommended for crypto currency trading or high volatility markets.
Green over Red= Buy Signal
Red over Green= Sell Signal
Green over White= Uptrend
Red under White= Downtrend

Bones1390's GANN Strategy AlertsThese are the alerts to go along with my GANN Strategy. You can find the strategy here:
If you like my stuff, leave me a comment below.
If you're feeling kind or want to show some appreciation, you can donate Bitcoin to this Address here:
3Jp9Kow1VxvzAiLLwCdeeQ2g11wKyaT4rC
Also if there's anything you want to talk about PM me! I'm free to speak about anything. Want a custom indicator? I can do my best to code it for you!
Thanks!
Bones

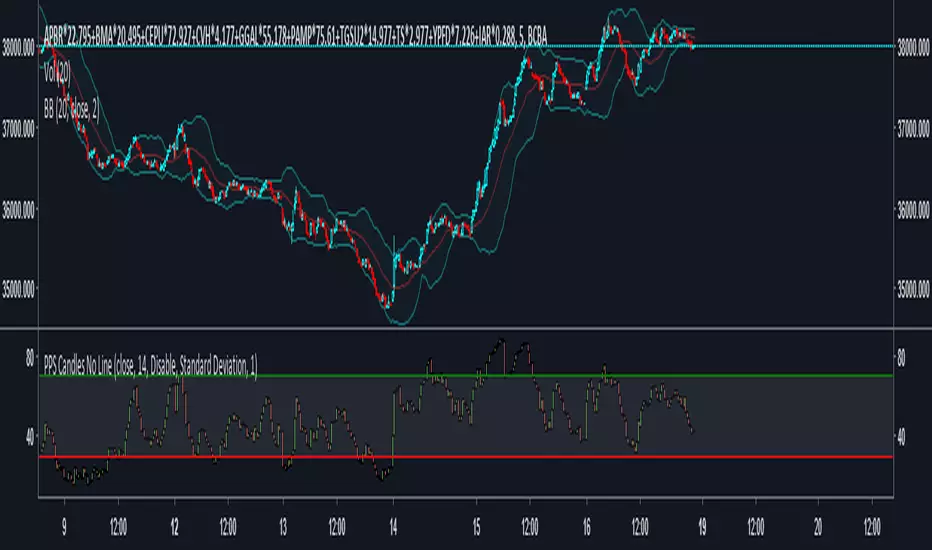
PpSignal ADX Moving Average The ADX indicator uses a smoothing moving average in its calculation and we find out that the best ADX indicator settings to use is 14 periods. ... The ADX indicator can only help us to gauge the intensity of the trend so we need to RSI or Ewo indicator for entry signals.
Gray color is hold, lime buy and orange sell.
