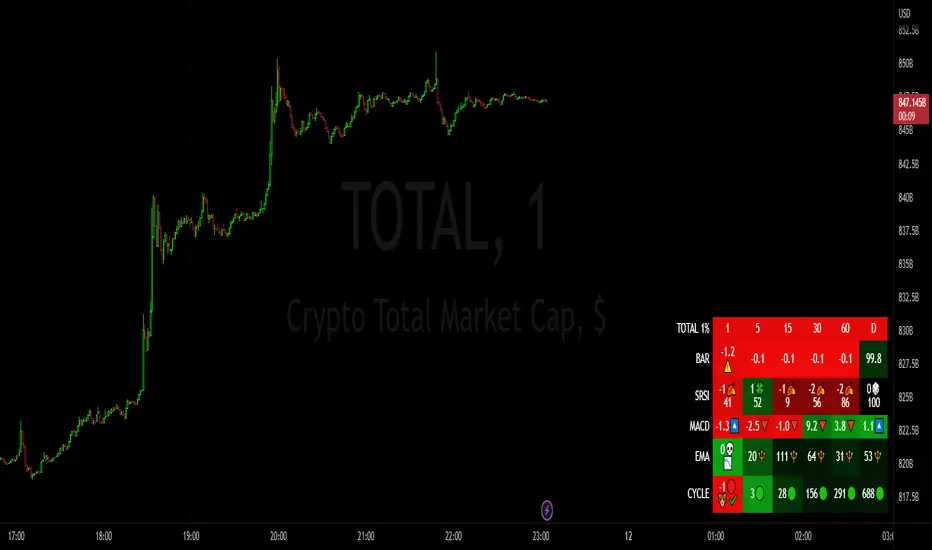
Market StatsIn this exciting new indicator...!
- You are able to select 6 different timeframes: 1 minute, 60 minute, 1 day, weekly, monthly, anything you please!
- With these timeframes, you are able to compare the different tema dema crossing percentages, to know whether the selected or current ticker is in an uptrend or downtrend!
- You are also able to formulate your very own EMA ratios to see in these different timeframes, or use the default, carefully optimized default EMA ratios per timeframe, to ultimately reveal the desired trends and whether these are in your favor for your position!
- Lastly, you have the RSI values at full display, also carefully optimized, for best alignment in indication of the current trend. To top it off, these RSI values are also displayed on the chart as well, should you choose to have it on display.
Cycle
CoG RSI Momenum Ichimoku CloudThis indicator is inspired by "RSI ICHIMOKU CLOUD".
Script plots price bars based on selected indicator with Ichimoku Cloud around it.
In my version I have added different oscillators for bar calculations.
Specifically you can choose from:
Center of Gravity(CoG)
Momentum
RSI

[_ParkF]cRSIHi, it's been a while since I posted a script.
This script basically puts the principle of convergence and divergence first.
(The Bollinger Band on the main chart is for reference)
The cRSI will move within the range of 0-100 just like the normal RSI
Along with that, there is a Donchian channel that will be the main activity area of the cRSI
If you know the characteristics of the Bollinger Band, it might be easy to understand
Basically, it will have the Expansion - Bulge - Squeeze Cycle
I wanted to express the movement of the wave visually.
Donchian Channel can be viewed to check Expansion - Bulge - Squeeze.
The centerline of the Donchian Channel is important because it plays a key role in identifying trends, such as 50 of the cRSI.
Also, Bear and Bull Divergence has 3 different colors
The reason is that the Divergence measurement period values are different.
Bear Divergence will be marked with Yellow, Orange, Red Label, and Bull Divergence will be marked with Green, Blue and Purple Label Purple. There will be a longer period of diversity in the order listed order.
I hope it helps your trading.
--------------------------------------------------------------------------------------------------------------------------------------------------------------------------------------------------------------------------------------------------------------------
안녕하세요, 오랜만에 새로운 지표를 올립니다.
이 지표는 기본적으로 수렴과 발산을 가장 중요하게 생각한 것입니다.
(메인 차트에 있는 볼린저 밴드는 참고를 위한 것입니다.)
cRSI는 일반적 RSI와 마찬가지로 0-100의 범위 안에서 움직이겠지만
그와 함께 cRSI의 주 활도 범위가 될 돈치안 채널이 함께 존재해서
볼린저 밴드의 특성을 알고 있다면 이해하기 쉬울 수 있을 것 같은데
기본적으로 Expansion - Bulge - Squeeze의 사이클을 가질 것이고
그 파동에 따른 RSI의 움직을 시각적으로 표현해보고 싶어서 만들었습니다.
돈치안 채널은 Expansion - Bulge - Squeeze 를 확인하기 위해 존재한다고 보면 될 것이고
돈치안 채널의 중심선은 cRSI의 50의 위치와 같이 추세를 확인하는데 있어
중점적인 역할을 하기 때문에 유의깊게 보면 좋습니다.
또, 하락과 상승 다이버전스는 각각 3가지 종류이고 색이 다릅니다.
이뉴는 각각의 다이버전스의 측정 기간값을 다르게 했기 때문이며,
하락 다이버전스는 노랑, 주황, 빨강 라벨로 표시 될 것이고
상승 다이버전스는 초록, 파랑, 보라 라벨로 표시 되며,
나열한 순서대로 더 긴 기간값의 다이버전스가 라벨로 플롯됩니다.
트레이딩에 도움이 됐으면 좋겠습니다.

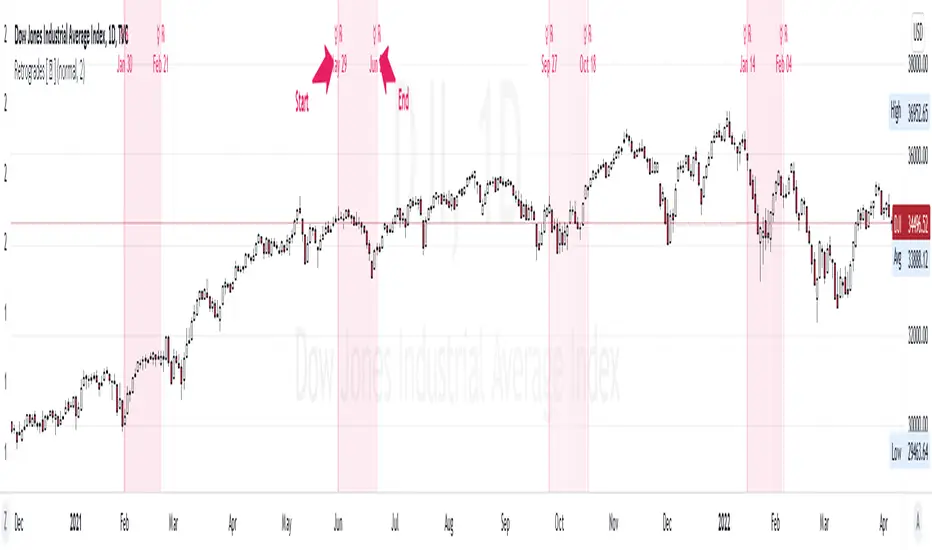
Cycle-Period Adaptive, Linear Regression Slope Oscillator [Loxx]Cycle-Period Adaptive, Linear Regression Slope Oscillator is an osciallator that solves for the Linear Regression slope and turns it into an oscillator. This is a very simple calculation and uses one of Ehler's first implementations of his cycle period calculations. The output slope value is smoothed after calculation and before being drawn. This is a sort of momentum indicator and has a rich history with Forex traders around the world.
What is the Cycle Period?
The spectral content of the data are measured in a bank of contiguous filters as described in "Measuring Cycle Periods" in the March 2008 issue of Stocks & Commodities Magazine. The filter having the strongest output is selected as the current dominant cycle period. The cycle period is measured as the number of bars contained in one full cycle period.
What is Linear Regression?
In statistics, linear regression is a linear approach for modeling the relationship between a scalar response and one or more explanatory variables. The case of one explanatory variable is called simple linear regression; for more than one, the process is called multiple linear regression.
Included:
Bar coloring
2 signal types
Alerts
Loxx's Expanded Source Types
Loxx's Moving Averages

Planetary Speed█ OVERVIEW
This script is designed to measure the speed of planets from Mercury to Pluto by comparing longitude data across time.
Planetary Speed cycles are very important for those trading Gann theory / Time theory and for Astrology Traders alike. You can toggle the mode of the planet
from a heliocentric setting to a geocentric one. This script is especially important for those who want to research the market and observe the effects of planetary cycles.
Planetary Speed works better on markets that do not close at the moment and on selected time frames ( all the default tradingview timeframes except the monthly ).
This script can also plot 250 days of future data with ease.
█ Future Plans and upgrades to this script may include :
1. Capability to work on different markets that do not open 24/7.
2. Adding lunar and solar speed.
And more! Feel free to contact me with any feature that you would like to see in this script
█ How to use :
1. Open the settings.
2. Select the planet.
3. Choose between Heliocentric and Geocentric
Then Press OK & give the script a few seconds and you should be set. You can add this script to your chart more than once!
This script is coded as an addon to the Gann ToolBox package/scripts.

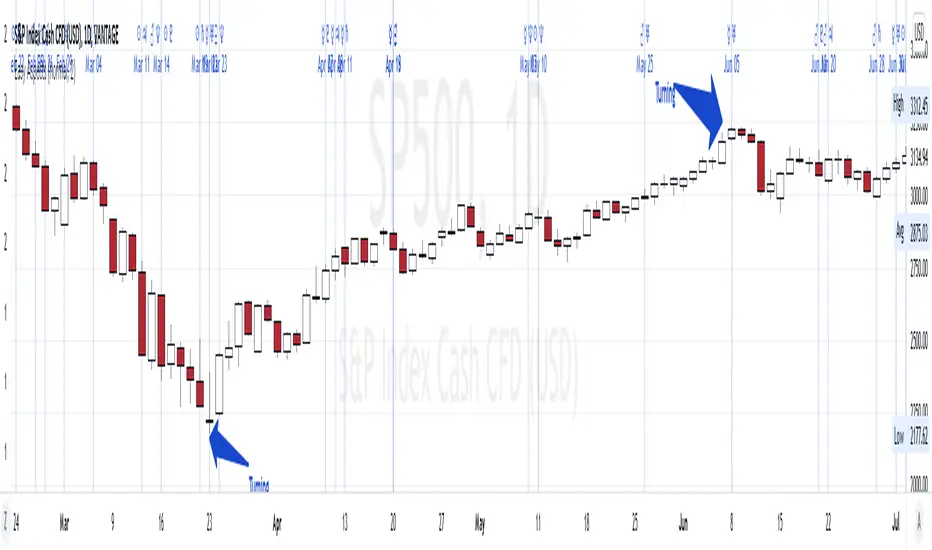
Sun Ingress ZodiacHi Traders,
Astrological signs of the tropical zodiac remain fixed relative to seasonal markers, such as the equinox and solstice points on the sky’s dome.
The zodiac used for the calculations does not correspond to the astronomical zodiac, but to 12 zones of 30 degrees along the ecliptic, measured from the position of the Sun at the spring equinox. The ecliptic is the plane of the Earth’s orbit around the Sun.
This script allows you see how Sun Ingress Zodiac can affect the Crypto, Stock, Indices & Commodity market.
The objectives of this script are:
1. you can see the Zodiac schedules in certain periods (earthsky.org)
2. you can see the correlation between Sun Ingress Zodiac and market reaction (is it turning or is it a swing high/ low? )
Those Dates are the Zodiac schedule (history & future), so when the Zodiac dates arrived, we can forecast the turning or swing high/low in the market (crypto, stocks, commodities & indices), the turning or swing high/low is +/- 1 day.
Those lines are just a simply vertical lines that can help us backtesting easily, hopefully we can take profit from this..
Here are some examples of the specific Zodiac affect:
Sun Ingress Aries
Sun Ingress Taurus
Sun Ingress Gemini
Sun Ingress Cancer
Sun Ingress Leo
Sun Ingress Virgo
Sun Ingress Libra
Sun Ingress Scorpio
Sun Ingress Sagittarius
Sun Ingress Capricorn
Sun Ingress Aquarius
Sun Ingress Pisces
PS:
when you subscribe, you will get:
1. Planetary Aspects & Transits (9 Planetary Ruler)
2. Retrogrades
3. Moon Phase, Moon Eclipse & 4 seasons
4. Easy Aspects (Trine & Sextile)
5. Hard Aspects (Opposition, Square & Conjunction)
6. Gann Seasonal Dates
7. Sun Ingress Zodiac

Moon Phases Strategy with CCI EXTRIME TPHELLO TO ALL ASTROLGY TRADING LOVERS
***im not a native english speaker and im not going to google translte it so soory for mastakes ****
this is an amzing script of moon cycle strategy
for long -
price need to be above MA
it will buy in full moon and will sell at new moon
i added an extrime CCI TP that if cci is over bought above 200 line it will close position- it cant be edited out so enjoy it.
for short-
price need to be below MA
it will short when new moon and buy back when fullmoon
i added an extrime CCI tp that if cci is oversold under -200 line it will close position - it cant be edited out so enjoy it.
just edit the new moon Reference date by your UTC TIME!!! ׂ( GOOGLE 'NEW MOON DATE')
לכל אוהבי האסטרולוגיה ומסחר בכוכבים
סקריפט פשוט מעולה!
ללונג- האסטרטגיה קונה כאשר המחיר מעל הממוצע ויש ירח מלא-היא מוכרת כאשר יש ירח חדש או כאשרס.ס.י חוצה את קו ה200
בשורט היא עושה ההפך ומוכרת כאשר יש ירח חדש והמחיר מתחת לממוצע-היא סוגרת את הפוזציה כאשר יש ירח מלא או כאשר ס.ס.י חוצה מטה את רמת המינוס 200
אנא ערכו את התאריך רפרנס לירח לפי אזור הזמן שלכם חפשו בגוגל ''תאריך ירח חדש'.
BACKTEST RETURNS SOOOOOO GOOOOD !
הבאק טסטים חוזרים מושלמים
trade with the stars and rip markets

Pi Cycle Indicators Comparison IndicatorThere are now 3 Pi Cycle Indicators that I am aware of; the original, improved**, and bottom.
This indicator attempts to provide all three indicators in a dingle, easy to view script.
I coded this script to displace the moving averages above and below the price bars for easy viewing. This was accomplished by placing a scaling factor (/# or *#) at the end of the ta.sma or ta.ema functions.
A vertical arrow, purposely posing as a short vertical line, marks the crossing of the long and short MAs for each indicator. These are color coded to match their respective indicators and the long and short MAs are similarly color coded for easy differentiation.
The red colored MAs and arrows above the price line are the Improved Pi-Cycle Top Indicator.
The green colored MAs and arrows below the price line are the Original Pi-Cycle Top Indicator.
The blue colored MAs and arrows below the green lines and price line are the Pi-Cycle Bottom Indicator.
One last feature of the chart is the use of the location function to enable easy comparison of the crossings of each indicator to the indicator itself and to the price. This can be accomplished simply by moving the chart up and down.
**{I should note that while researching this I found that BitcoinMamo turns out to have beat me to the punch on the Improved Indicator Long.Short and Multiplier numbers. He should therefor get the credit for that}

Bitcoin Golden Pi CyclesTops are signaled by the fast top MA crossing above the slow top MA, and bottoms are signaled by the slow bottom MA crossing above the fast bottom MA. Alerts can be set on top and bottom prints. Does not repaint.
Similar to the work of Philip Swift regarding the Bitcoin Pi Cycle Top, I’ve recently come across a similar mathematically curious ratio that corresponds to Bitcoin cycle bottoms. This ratio was extracted from skirmantas’ Bitcoin Super Cycle indicator . Cycle bottoms are signaled when the 700D SMA crosses above the 137D SMA (because this indicator is closed source, these moving averages were reverse-engineered). Such crossings have historically coincided with the January 2015 and December 2018 bottoms. Also, although yet to be confirmed as a bottom, a cross occurred June 19, 2022 (two days prior to this article)
The original pi cycle uses the doubled 350D SMA and the 111D SMA . As pointed out this gives the original pi cycle top ratio:
350/111 = 3.1532 ≈ π
Also, as noted by Swift, 111 is the best integer for dividing 350 to approximate π. What is mathematically interesting about skirmanta’s ratio?
700/138 = 5.1095
After playing around with this for a while I realized that 5.11 is very close to the product of the two most numerologically significant geometrical constants, π and the golden ratio, ϕ:
πϕ = 5.0832
However, 138 turns out to be the best integer denominator to approximate πϕ:
700/138 = 5.0725 ≈ πϕ
This is what I’ve dubbed the Bitcoin Golden Pi Bottom Ratio.
In the spirit of numerology I must mention that 137 does have some things going for it: it’s a prime number and is very famously almost exactly the reciprocal of the fine structure constant (α is within 0.03% of 1/137).
Now why 350 and 700 and not say 360 and 720? After all, 360 is obviously much more numerologically significant than 350, which is proven by the fact that 360 has its own wikipedia page, and 350 does not! Using 360/115 and 720/142, which are also approximations of π and πϕ respectively, this also calls cycle tops and bottoms.
There are infinitely many such ratios that could work to approximate π and πϕ (although there are a finite number whose daily moving averages are defined). Further analysis is needed to find the range(s) of numerators (the numerator determines the denominator when maintaining the ratio) that correctly produce bottom and top signals.

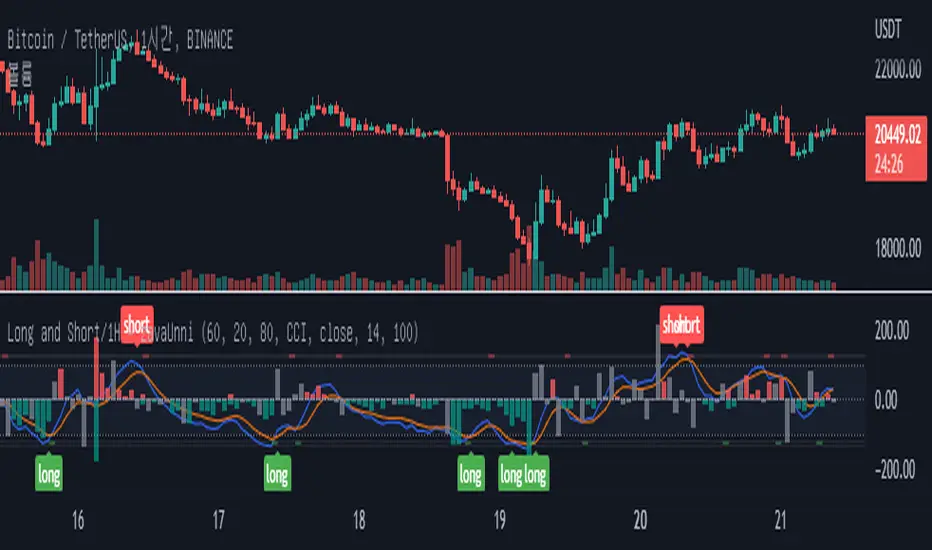
Long and Short Signal_1hours [zavaUnni]This indicator is available in the 1 hour chart.
The Stochastic value of 1 hour of 3 types of length was requested, summed, and then the value was derived.
The blue line is the K and the orange line is D of the Stochastic.
The default is Stochastic, but when RSI is selected in the settings, it can be viewed as the relative strength index of the Stochastic.
If the K value crosses down at 100, a short signal is generated
Cross up below -100 and you'll get a long signal.
You can receive a ready signal by checking Position Ready in Settings.
Short ready signal when the k line goes up to 100.
Long ready signal when the k line goes below -100.
A small spread value of the candle relative to the volume is the principle that resistance has occurred.
Displayed the resistance value based on the average value of the last 100 candles.
The higher the value of the red Histogram, the stronger the selling.
The lower the value of the green Histogram value, the stronger the buying .
The gray histogram is when there's no buying or selling pressure.
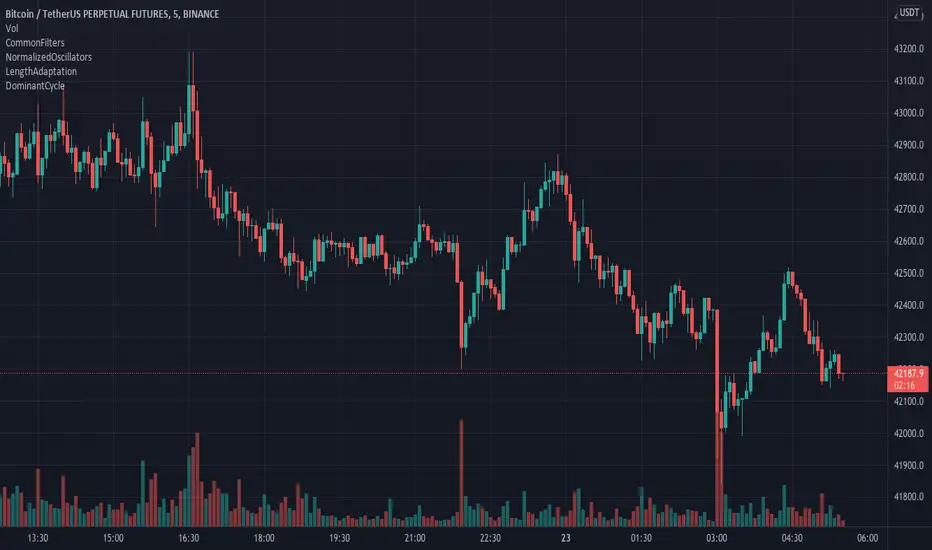
Hybrid, Zero lag, Adaptive cycle MACD [Loxx]TASC's March 2008 edition Traders' Tips includes an article by John Ehlers titled "Measuring Cycle Periods," and describes the use of bandpass filters to estimate the length, in bars, of the currently dominant price cycle.
What are Dominant Cycles and Why should we use them?
Even the most casual chart reader will be able to spot times when the market is cycling and other times when longer-term trends are in play. Cycling markets are ideal for swing trading however attempting to “trade the swing” in a trending market can be a recipe for disaster. Similarly, applying trend trading techniques during a cycling market can equally wreak havoc in your account. Cycle or trend modes can readily be identified in hindsight. But it would be useful to have an objective scientific approach to guide you as to the current market mode.
There are a number of tools already available to differentiate between cycle and trend modes. For example, measuring the trend slope over the cycle period to the amplitude of the cyclic swing is one possibility.
We begin by thinking of cycle mode in terms of frequency or its inverse, periodicity. Since the markets are fractal; daily, weekly, and intraday charts are pretty much indistinguishable when time scales are removed. Thus it is useful to think of the cycle period in terms of its bar count. For example, a 20 bar cycle using daily data corresponds to a cycle period of approximately one month.
When viewed as a waveform, slow-varying price trends constitute the waveform's low frequency components and day-to-day fluctuations (noise) constitute the high frequency components. The objective in cycle mode is to filter out the unwanted components--both low frequency trends and the high frequency noise--and retain only the range of frequencies over the desired swing period. A filter for doing this is called a bandpass filter and the range of frequencies passed is the filter's bandwidth .
Indicator Features
-Zero lag or Regular MACD/signal calculation
- Fixed or Band-pass Dominant Cycle for MACD and Signal MA period inputs
-10 different moving average options for both MACD and Signal MA calculations
-Separate Band-pass Dominant Cycle calculations for both MACD and Signal MA calculations
- Slow-to-Fast Band-pass Dominant Cycle input to tweak the ratio of MACD MA input periods as they relate to each other

Sentimental Cycles with CrossingsThis indicator provides the following options, where you can choose to display:
DEMA TEMA cycles, filtered by default with sentiment.
Sentiment cloud, based on the 200ema area between the 1 minute and 1 hour lines.
One or both ema crossings with their respective timeframes (independent from current chart timeframe) and optional line display.
One or two tickers and their respective crossings based on selected timeframes.
Additional EMA lines supplied with their very own timeframe.
This indicator is intended to be used any way suitable to the user, nearly every aspect is customizable, and the defaults are just enough to get you started on deciding whether it's time to enter calls or puts.
TIPS for optimal results:
- Try using 2 charts: the 1 minute and the 1 hour per symbol. Under the 1 minute chart, use the 3 minute and 5 minute timeframe for crossings.
- Try to start a position when a sentimental DEMA TEMA cloud is beginning to form. The first bar usually pays thicc.
- Tickers SPY and VXX can be of good reference for market direction. If all crossings coincide, it's because there's a strong momentum in a certain direction for the market.

Easy AspectsHi Traders,
Planetary Aspects divided into 2 parts, Hard (Square and Opposition) & Easy (Trine and Sextile) Aspects, the Conjunction is depending on the planets.
This Easy Aspects script, contains:
1. Trine is an angle of 120°, which is 1/3 of the 360° ecliptic
2. Sextile is an angle of 60°, which is 1/6 of the 360° ecliptic or 1/2 a trine (120°)
The objectives of this script are:
1. you can see the Hard Aspects schedule in certain periods, history and future.. (you can double check it in horoscopes.astro-seek.com )
2. this script allows you see based on specific aspect view, you can observe the correlation between the hard aspects and market reaction (is it turning or is it a swinghigh/ low?
Here are some examples;
TRINE
Sextile
Hard Aspects Hi Traders,
Planetary Aspects divided into 2 parts, Hard (Square and Opposition) & Easy (Trine and Sextile) Aspects, the Conjunction is depending on the planets.
This Hard Aspects script, contains:
1. Square is an angle of 90°, which is 1/4 of the 360° ecliptic or 1/2 an opposition (180°)
2. Opposition is an angle of 180°, which is 1/2 of the 360° ecliptic
3. Conjunction is an angle of approximately (~) 0–10°. Typically, an orb of ~10° is considered to be a Conjunction ( I include Opposition in this script).
The objectives of this script are:
1. you can see the Hard Aspects schedule in certain periods, history and future.. (you can double check it in horoscopes.astro-seek.com )
2. this script allows you see based on specific aspect view, you can observe the correlation between the hard aspects and market reaction (is it turning or is it a swinghigh/ low?
Here are some examples;
SQUARE:
OPPOSITION
CONJUNCTION

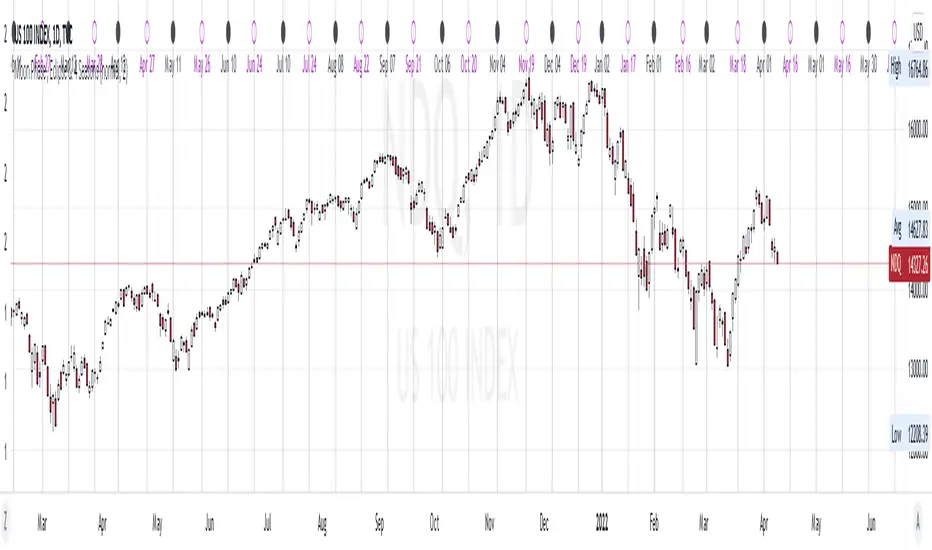
Moon Phase , Eclipse & 4 SeasonsHi Traders,
This script is a little bit different than the others Moon Phase scripts, added Moon Eclipse and 4 Seasons..
The objectives of this script:
1. you can see the Moon Phase schedule at certain periods (you can double check it in mooncalendar.astro-seek.com)
2. you can see the correlation between the Moon Phase and market reaction
3. you can see the correlation between the Moon Eclipse and market reaction
4. you can see the correlation between the 4 Seasons and market reaction
Those Dates are the Moon Phase (history & future), so when the Moon Phase arrived, we can forecast the turning or swinghigh/low in the market (cryptos, stocks, commoditties & indexes), the turning or swinghigh/low is +/- 1 day.
Those lines are just a simply vertical lines that can help us backtest easily, hopefully we can take profit from this Moon Phase..
New Moon & Full Moon
New Moon
Full Moon
Moon Eclipse
4 Seasons (Spring Equinox, Summer Solstice, Autumn Equinox, Winter Solstice)
Retrogrades hi Traders,
The objectives of this script:
1. you can see the Retrogrades schedule at certain periods ((you can double check it in horoscopes.astro-seek.com)
2. you can see the correlation between the Retrogrades and market reaction
What Is Retrograde Motion?
The astronomical explanation for retrograde motion starts with understanding that the planets in our solar system orbit the Sun at different distances and speeds.
While we orbit the Sun ourselves, we can observe the other planets moving across our sky, following their own paths.
Sometimes, it can appear (from our perspective) that a planet has abruptly switched directions and has started to move in reverse across the sky.
This is, of course, an illusion caused by the position of Earth in relation to that of the planet, since a planet in orbit always travels in one set direction and can’t suddenly reverse course.
This is why we call the phenomenon apparent retrograde motion, as it only looks like the planet is moving backward (“retrograde motion”)!
This Retrogrades script, contains all of Planetary Retrogrades Motion;
1. Mercury Retrogrades ( ≈ 21 days )
2. Jupiter Retrogrades ( ≈ 121 days )
3. Venus Retrogrades ( ≈ 41 days )
4. Uranus Retrogrades ( ≈ 151 days )
5. Mars Retrogrades ( ≈ 72 days )
6. Saturn Retrogrades ( ≈ 138 days )
7. Pluto Retrogrades ( ≈ 159 days )
8. Neptune Retrogrades ( ≈ 158 days )
Here are some examples or Retrogrades:
Jupiter Retrograde
Venus Retrograde
Uranus Retrofrade
Mars Retrograde
Saturn Retrograde
Pluto Retrograde
Neptune Retrograde
DominantCycleCollection of Dominant Cycle estimators. Length adaptation used in the Adaptive Moving Averages and the Adaptive Oscillators try to follow price movements and accelerate/decelerate accordingly (usually quite rapidly with a huge range). Cycle estimators, on the other hand, try to measure the cycle period of the current market, which does not reflect price movement or the rate of change (the rate of change may also differ depending on the cycle phase, but the cycle period itself usually changes slowly). This collection may become encyclopaedic, so if you have any working cycle estimator, drop me a line in the comments below. Suggestions are welcome. Currently included estimators are based on the work of John F. Ehlers
mamaPeriod(src, dynLow, dynHigh) MESA Adaptation - MAMA Cycle
Parameters:
src : Series to use
dynLow : Lower bound for the dynamic length
dynHigh : Upper bound for the dynamic length
Returns: Calculated period
Based on MESA Adaptive Moving Average by John F. Ehlers
Performs Hilbert Transform Homodyne Discriminator cycle measurement
Unlike MAMA Alpha function (in LengthAdaptation library), this does not compute phase rate of change
Introduced in the September 2001 issue of Stocks and Commodities
Inspired by the @everget implementation:
Inspired by the @anoojpatel implementation:
paPeriod(src, dynLow, dynHigh, preHP, preSS, preHP) Pearson Autocorrelation
Parameters:
src : Series to use
dynLow : Lower bound for the dynamic length
dynHigh : Upper bound for the dynamic length
preHP : Use High Pass prefilter (default)
preSS : Use Super Smoother prefilter (default)
preHP : Use Hann Windowing prefilter
Returns: Calculated period
Based on Pearson Autocorrelation Periodogram by John F. Ehlers
Introduced in the September 2016 issue of Stocks and Commodities
Inspired by the @blackcat1402 implementation:
Inspired by the @rumpypumpydumpy implementation:
Corrected many errors, and made small speed optimizations, so this could be the best implementation to date (still slow, though, so may revisit in future)
High Pass and Super Smoother prefilters are used in the original implementation
dftPeriod(src, dynLow, dynHigh, preHP, preSS, preHP) Discrete Fourier Transform
Parameters:
src : Series to use
dynLow : Lower bound for the dynamic length
dynHigh : Upper bound for the dynamic length
preHP : Use High Pass prefilter (default)
preSS : Use Super Smoother prefilter (default)
preHP : Use Hann Windowing prefilter
Returns: Calculated period
Based on Spectrum from Discrete Fourier Transform by John F. Ehlers
Inspired by the @blackcat1402 implementation:
High Pass, Super Smoother and Hann Windowing prefilters are used in the original implementation
phasePeriod(src, dynLow, dynHigh, preHP, preSS, preHP) Phase Accumulation
Parameters:
src : Series to use
dynLow : Lower bound for the dynamic length
dynHigh : Upper bound for the dynamic length
preHP : Use High Pass prefilter (default)
preSS : Use Super Smoother prefilter (default)
preHP : Use Hamm Windowing prefilter
Returns: Calculated period
Based on Dominant Cycle from Phase Accumulation by John F. Ehlers
High Pass and Super Smoother prefilters are used in the original implementation
doAdapt(type, src, len, dynLow, dynHigh, chandeSDLen, chandeSmooth, chandePower, preHP, preSS, preHP) Execute a particular Length Adaptation or Dominant Cycle Estimator from the list
Parameters:
type : Length Adaptation or Dominant Cycle Estimator type to use
src : Series to use
len : Reference lookback length
dynLow : Lower bound for the dynamic length
dynHigh : Upper bound for the dynamic length
chandeSDLen : Lookback length of Standard deviation for Chande's Dynamic Length
chandeSmooth : Smoothing length of Standard deviation for Chande's Dynamic Length
chandePower : Exponent of the length adaptation for Chande's Dynamic Length (lower is smaller variation)
preHP : Use High Pass prefilter for the Estimators that support it (default)
preSS : Use Super Smoother prefilter for the Estimators that support it (default)
preHP : Use Hann Windowing prefilter for the Estimators that support it
Returns: Calculated period (float, not limited)
doEstimate(type, src, dynLow, dynHigh, preHP, preSS, preHP) Execute a particular Dominant Cycle Estimator from the list
Parameters:
type : Dominant Cycle Estimator type to use
src : Series to use
dynLow : Lower bound for the dynamic length
dynHigh : Upper bound for the dynamic length
preHP : Use High Pass prefilter for the Estimators that support it (default)
preSS : Use Super Smoother prefilter for the Estimators that support it (default)
preHP : Use Hann Windowing prefilter for the Estimators that support it
Returns: Calculated period (float, not limited)
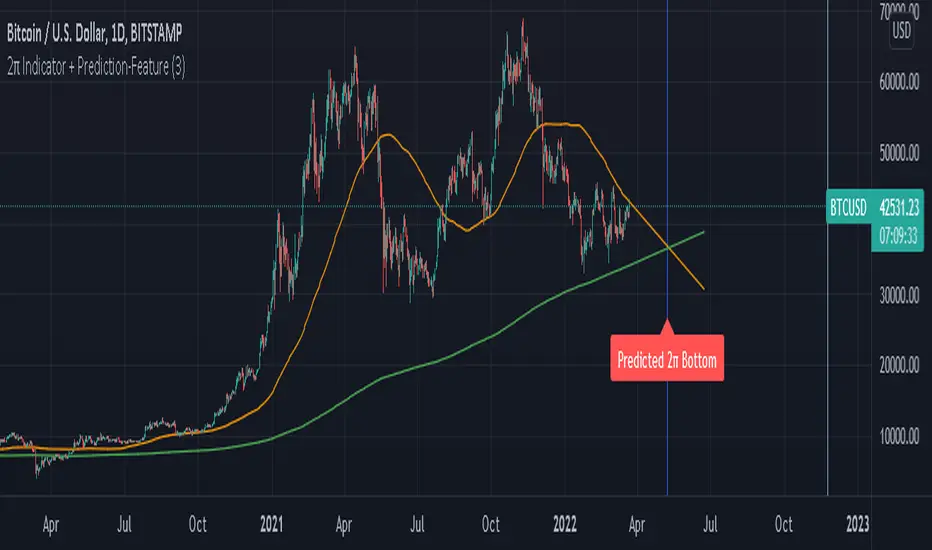
2π Indicator including Prediction-FeaturePI Cycle indicator is very good on finding potential tops.
PI cycle uses the 350MA/111MA which equals around 3,14
Using the 700MA its very obvious that we can spot potential Bottoms.
We are also using the 111MA, so 700MA/111MA equals to 6,30 which is ~ 2π.
I also built in a Prediction feature so we could speculate on a potential Bottom in the future.
Obviously the prediction might change over time if price is more volatily it changes the outcome.
Use Daily chart for best results.
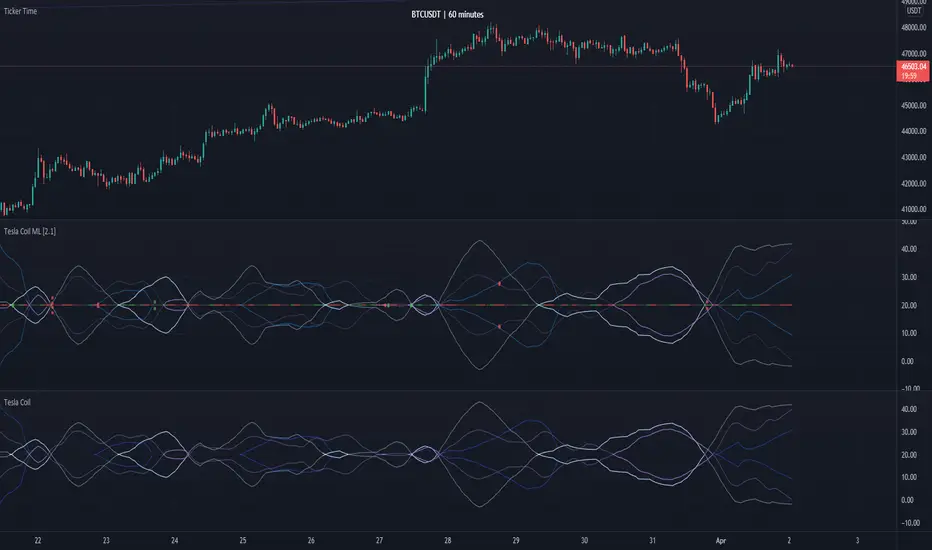
Tesla Coil MLThis is a re-implementation of @veryfid's wonderful Tesla Coil indicator to leverage basic Machine Learning Algorithms to help classify coil crossovers. The original Tesla Coil indicator requires extensive training and practice for the user to develop adequate intuition to interpret coil crossovers. The goal for this version is to help the user understand the underlying logic of the Tesla Coil indicator and provide a more intuitive way to interpret the indicator. The signals should be interpreted as suggestions rather than as a hard-coded set of rules.
NOTE: Please do NOT trade off the signals blindly. Always try to use your own intuition for understanding the coils and check for confluence with other indicators before initiating a trade.
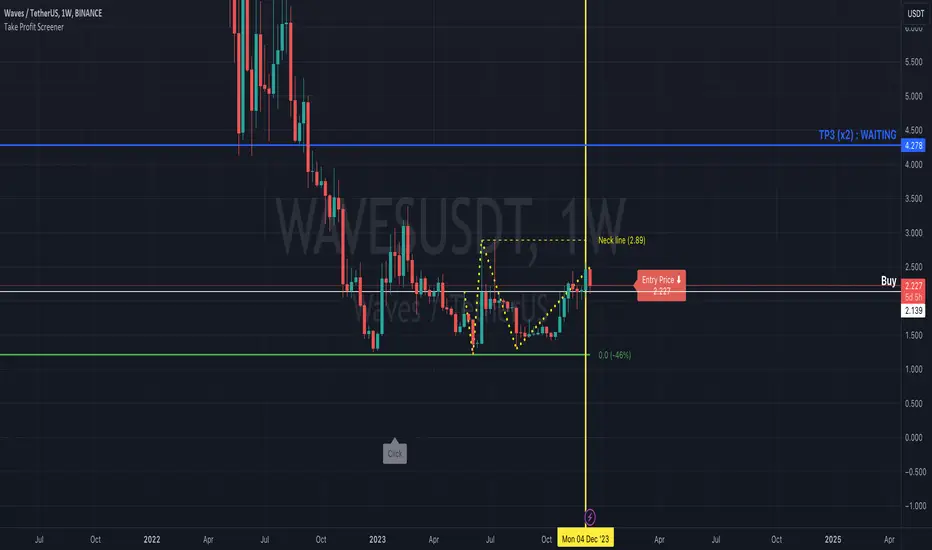
Take Profit ScreenerI'm going to introduce you to the Take Profit Screener tool.
It allows you to manually scan your watchlist to determine at a glance the assets that have the best profitability potential.
It is a 2 in 1 tool that allows you to :
identify where your Take Profit ratios are located whether you are in SHAD or Cycle Strategy
identify the potential reward percentages when approaching the key Fibonacci levels
Before you start using it, you need to:
sort your watchlist according to the price (Last) in order to have price ranges more or less close to each other when jumping from a symbol to another
disable the Auto Scale and Magnet feature
select your first symbol
display the tool (the indicator more exactly)
The settings dialog box is organised in 3 sections:
Strategy : By setting this section, you will answer the question " Where do my Take Profit ratios stand in relation to my entry price, and according to Risk Management Strategy adopted (SHAD or Cycle)? "
Fibonacci : By setting this section, you will answer the question " What percentage gain can I expect as I approach one of the key Fibonacci levels? "
Layout : This is the settings for the look and feel
Strategy Section
Active : This part of the indicator won't display on your chart if unchecked
Type : Choose between SHAD or Cycle Strategy. When choosing SHAD, you can select 2, 4, 8 or 16 SHAD Levels. When choosing Cycle, you can enter whatever ratio value you wish in the Strategy Ratio (Cycle only) input.
SHAD xNN : When choosing SHAD Strategy, you should select at least one level and more if need be.
Strategy Ratio (Cycle only) : When choosing Strategy Type Cycle, you can enter whatever ratio value you wish there.
Freeze Entry Price & Value : Leave it unchecked whenever the current price of the asset is located within your desired area (i.e. Reload Zone) while attempting to estimate its potential reward. Conversely, keep it checked whenever the current price of the asset is outside your desired area, but you need to anticipate the potential reward of this asset if its price reaches a certain level, your Entry price. Enter this price there and check the box.
Show price : If checked, both Take Profit ratio and Price are displayed. If unchecked, then price is hidden.
Extend Line : If checked, then lines showing Take Profit levels extend to the left.
Label Offset : If checked, then the label that displays Take Profit ratio and price shift to the right by a value that ranges from 0 to 100 candles.
Label Style : You can choose between Right or Top. This will determine the orientation of the label.
Fibonacci Section
Active : This part of the indicator won't display on your chart if unchecked
Type : Choose between SHAD or Cycle Strategy. When choosing SHAD, you can select 2, 4, 8 or 16 SHAD Levels. When choosing Cycle, you can enter whatever ratio value you wish in the Strategy Ratio (Cycle only) input.
SHAD xNN : When choosing SHAD Strategy, you should select at least one level and more if need be.
Strategy Ratio (Cycle only) : When choosing Strategy Type Cycle, you can enter whatever ratio value you wish there.
Freeze Entry Price : Leave it unchecked whenever the current price of the asset is located within your desired area (i.e. Reload Zone) while attempting to estimate its potential reward. Conversely, keep it checked whenever the current price of the asset is outside your desired area, but you need to anticipate the potential reward of this asset if its price reaches a certain level, your Entry price. Enter this price there and check the box.
Color : You can define the color of Fibonacci line levels
Ultimate HODL WaveThe basis for this indicator is the HODL Wave (> 1 Year) developed by Unchained Capital. This represents the percentage of coins that have not been moved for at least a year.
The Hull MA perfectly tracks the HODL Wave and provides an easy bull/bear trend in the mid-term.
The long-term and more macro bull/bear trend is decided by if the Hull MA is above or below the base MA.
I have purposefully chosen the 365 day length for the Hull MA and the 730 day for the base MA on the daily timeframe since they represent 1 year and 2 years respectively.

AnNam RSI Cycle [PlungerMen] This script improves the default RSI 14
1: it identifies regions of the RSI which are oversold and overbought by changing the color of RSI from white to red.
2: it adds additional reference lines at 20,25.. 75,80 to better gauge the RSI value
Finally, the coolest feature, the middle 50 line is used to indicate which cycle the price is currently at
A green color at the 50 line indicates a bullish cycle, a red color indicators a bearish cycle, and a white color indicates a neutral cycle.
The cycles are determined using the RSI as follows:
if RSI is overbought, cycle switches to bullish until RSI falls below 40 , at which point it becomes neutral
if RSI is oversold, cycle switches bearish until RSI rises above 60, at which point it becomes neutral
a neutral cycle is exited at either overbought or oversold conditions
Thank for TradeCamily!

Bitcoin Bull Runs Mid Cycle Aligned This script plots 2 lines which are the 2013 and 2016 bull run. The plots are aligned on their mid cycles to the 2021 mid cycle.
Settings:
You can move the plots on the x and y axis in the settings for the Daily, Weekly and Monthly TFs.
The plot is weird on the Monthly TF, best to use the Daily and Weekly.
If it doesn't load at first you have to zoom out fully and go back to 2013 for it to load. Then it will load.
